


Update (Wednesday, Feb 11 at 11 AM ET): Data now extends through Wednesday morning, adding two full days of post-game decay to the time series. The leaderboard has shifted -- and the decay patterns are where the real story is.
Updated leaderboard (peak vs. pre-game baseline):
- Budweiser: 18x (now #1 -- Clydesdale magic from an ultra-low baseline)
- Liquid Death: 13.1x (vertical spike, instant crash back to baseline within 4 hours)
- Hellmann's: 11.6x (sparse baseline, massive spike, surprisingly sustained Monday interest)
- Levi's: 9.2x (peaked during ad airing pre-kickoff, below baseline by Wednesday)
- Mandalorian: 6.5x (most sustained post-game interest of any entertainment brand)
The post-game decay tells the real story.
Most brands returned to baseline search volume within 8 hours of kickoff. An $8M ad buys about half a news cycle of attention for most categories.The standout exception:
Hims & Hers produced a second search spike Monday morning -- the only brand to show sustained, rising interest after the initial game-night peak. The provocative "Rich People Live Longer" messaging generated enough controversy and conversation to keep people searching well into the work week. No other brand showed this pattern.At the other extreme,
Liquid Death hit 100 at kickoff and was back to 11 four hours later. The spike was real but the attention was gone before the post-game show ended.The interactive charts now reflect the full window through Wednesday, including post-game decay curves for all 15 tracked brands.
This analysis uses live Google Trends data for 15 Super Bowl advertisers, measured at 4-hour intervals over a 7-day window (43 data points per brand). Interactive charts and comparison views are live and will be updated as additional observations are added this week.
Original post is below, from Monday, February 9th at 11am ET:
-----
Every year after the Super Bowl, the same claims appear.
“Brand X broke the internet.”
“Brand Y won the night.”
Those statements usually rely on a single moment: the peak.
This analysis looks at the full time series instead.
How the data was collected
Search interest was pulled from Google Trends for 15 Super Bowl advertisers in the United States. Each brand was tracked across 43 evenly spaced intervals covering the days before, during, and after the game.
This makes it possible to separate three things that are often collapsed into one:
- baseline demand before the ad
- timing of peak interest
- rate of decay after the spike
Pattern 1: game-night shock spikes
The largest spike multipliers came from brands with very low pre-game search volume.
Current top of the leaderboard (peak vs pre-game baseline):
- Mandalorian & Grogu: 20.3x (Entertainment, “A New Journey Begins”)
- Budweiser: 19.1x (Beer, “American Icons”)
- Hellmann’s: 18.3x (Food, “Meal Diamond”)
- Hims & Hers: 14.6x (Health & Wellness, “Rich People Live Longer”)
- Liquid Death: 13x (Beverages, “Exploding Heads”)
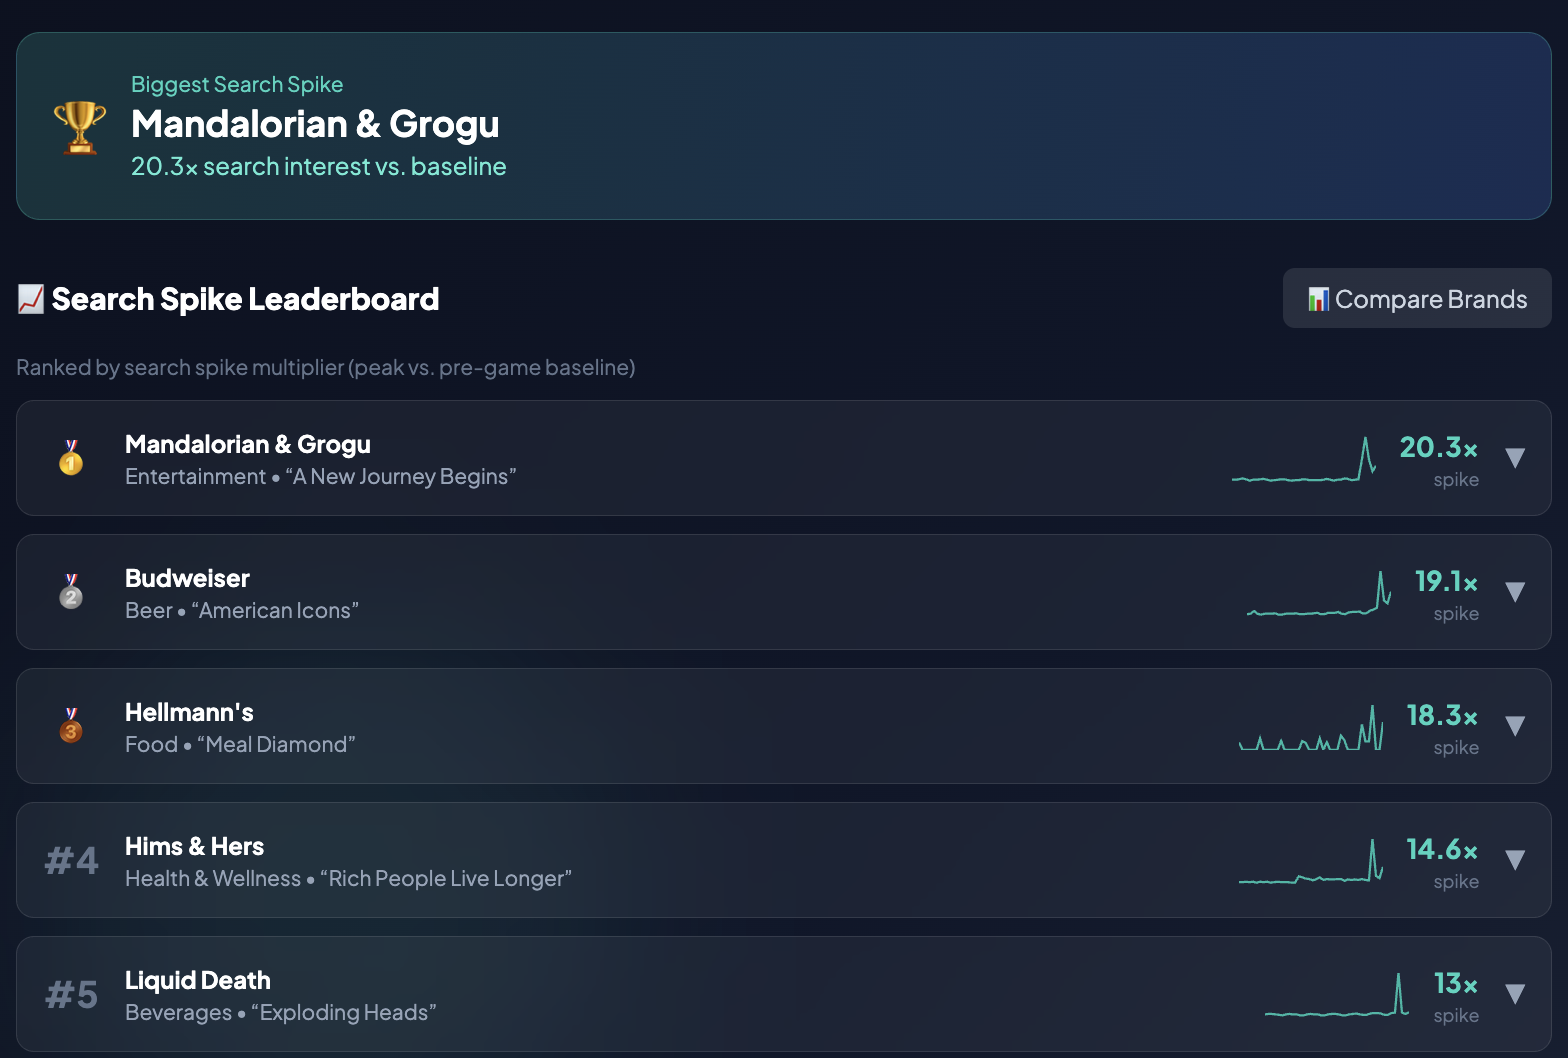
These curves share the same shape: flat baseline, sharp rise at kickoff or ad airing, followed by a rapid decline.
A high multiplier here reflects surprise relative to baseline. It does not indicate how long attention persisted or whether demand converted.
Pattern 2: pre-game interest peaks
Several technology brands reached their highest search interest before the game aired.
Anthropic, OpenAI, and Coinbase all peaked in the days leading up to kickoff.
Their curves rise gradually, level off, and then flatten or fall during the game itself.
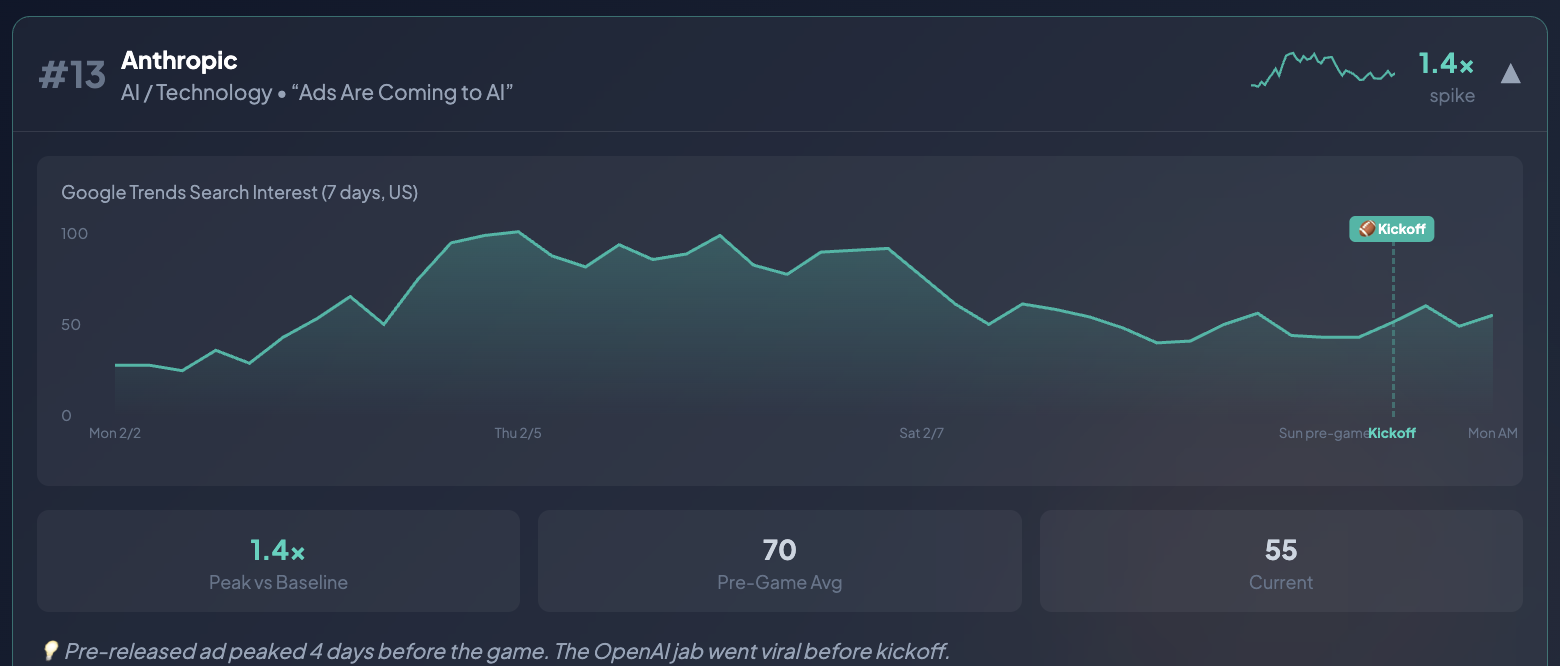
The timing aligns with pre-released ads, media coverage, and discussion outside the broadcast window. In these cases, the Super Bowl ad coincided with existing demand rather than creating it.
Pattern 3: high-baseline brands
Brands such as Uber Eats, Volkswagen, and Google Gemini showed limited relative movement during the game.
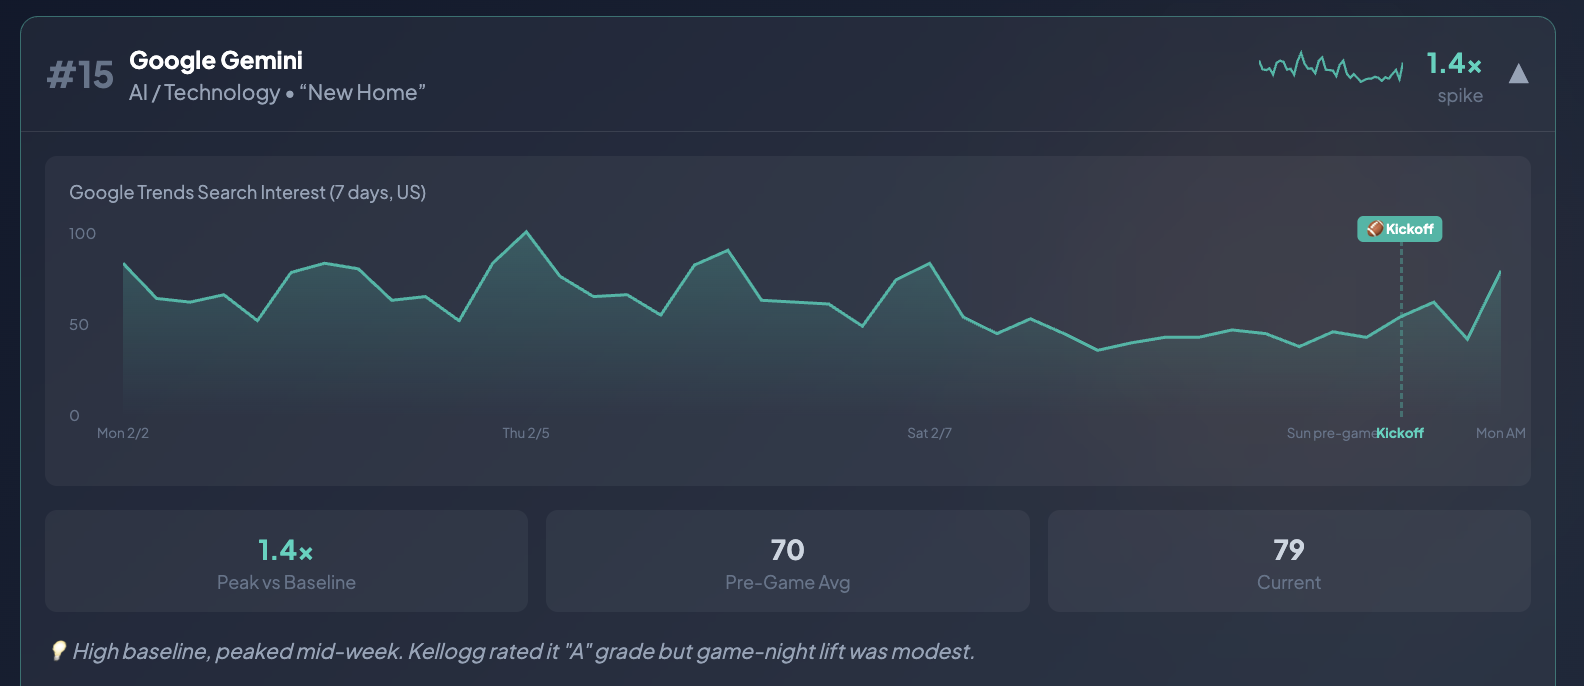
Their search volume was already elevated before kickoff, which reduces the size of any percentage increase. The lines remain comparatively stable across the window, with no pronounced inflection at game time.
Low volatility here reflects existing demand rather than weak performance.
What the leaderboard shows—and what it does not
Ranking brands by spike multiplier surfaces which ads produced the largest short-term deviation from baseline.
It does not show:
- total search volume
- duration of interest
- post-game behavior
- downstream outcomes
For that reason, the leaderboard describes attention relative to baseline, not results.
Why timing matters more than peaks
Looking at all 43 data points changes the interpretation.
A peak during the game, a peak before kickoff, and a flat line across the week can all be rational outcomes depending on the brand’s position and strategy. Without the full series, those differences disappear.
This analysis focuses on when interest appears and how long it lasts, rather than how high it climbs.
How this connects to Analytics Mates
This approach reflects how Analytics Mates evaluates performance: full sequences instead of single moments, baselines instead of headlines, and patterns instead of rankings.
The interactive charts published alongside this post show the complete time series, kickoff markers, and multi-brand comparisons used for this analysis.
Additional annotations and breakdowns will be added as the week progresses.
Check out The Helm, our new AI Powered Analytics Agent if you want this type of analysis for your own company (and competitors).
See Article Images


