


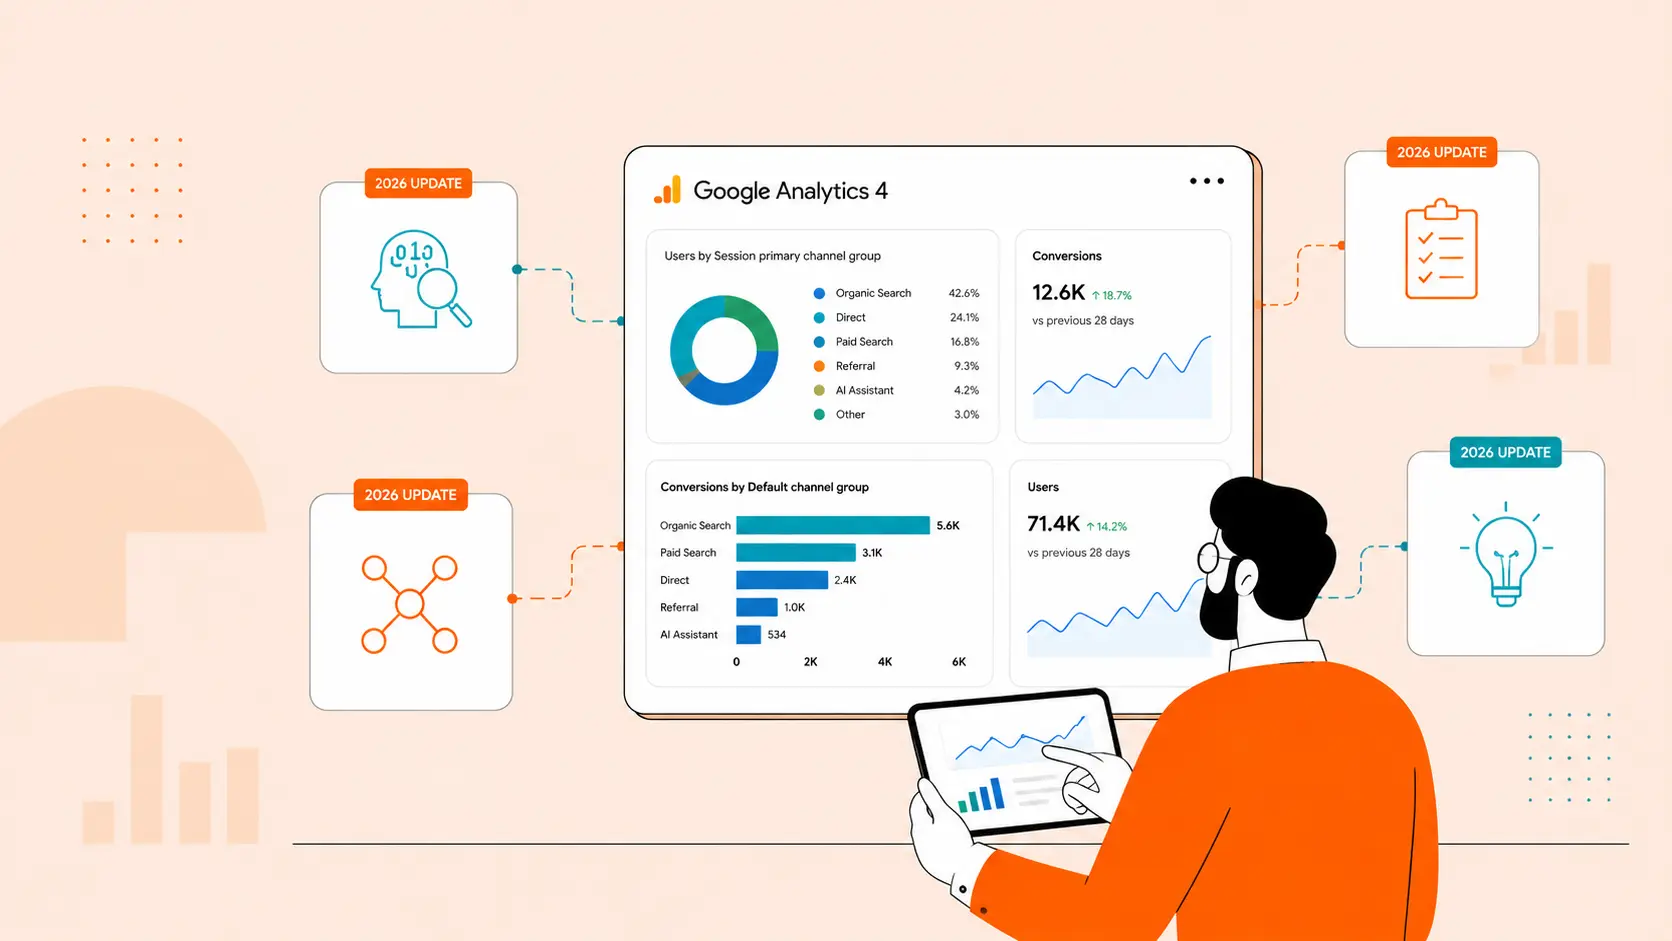


Google Analytics 4 is a powerful tool that can help you understand your website traffic and user behavior. However, the data that GA4 collects can be overwhelming. That's why it's important to set up standard and custom reports.
Standard reports provide essential information about your users, such as their demographics, acquisition channels, and engagement metrics. Custom reports allow you to tailor analytics to your specific business goals. By setting up standard and custom reports, you can uncover patterns, identify opportunities, and make data-driven decisions. This can help you improve your website content, marketing campaigns, and product offerings.
In this blog post, we will discuss the importance of setting up standard and custom reports in GA4. We will also provide some tips for creating effective reports.
Benefits of Learning Standard and Setting Up Custom Reports
- Improved understanding of your users: Standard and custom reports can help you understand your users better. This includes their demographics, interests, and behavior on your website.
- Identifying opportunities: By understanding your users, you can identify opportunities to improve your website and marketing campaigns. For example, you might find that a particular demographic is more likely to convert into customers.
- Making data-driven decisions: Standard and custom reports can help you make data-driven decisions. This means that you can use the data to make informed decisions about your website, marketing campaigns, and product offerings.
- Increased efficiency: Standard and custom reports can help you save time and improve your efficiency. This is because you can use the reports to quickly find the information you need.
Getting into the Standard Reports in GA4
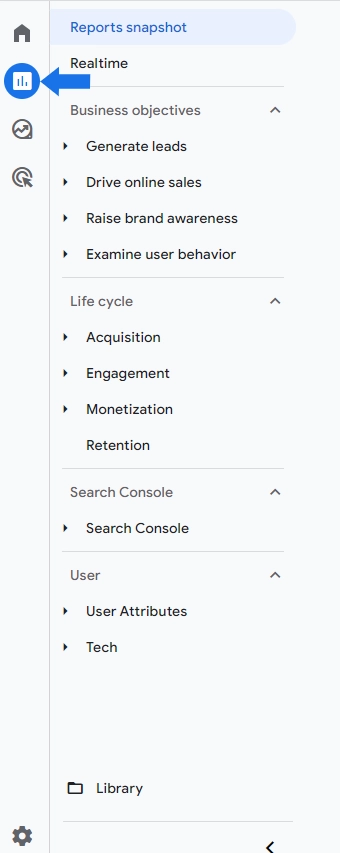
You can access the Standard reports by clicking the "Reports" button in the left-hand navigation menu. (see blue arrow below)
Standard Reports in GA4
1) The Realtime Report
This report enables you to monitor website or app actions as they happen. The cards are organized to help you see how users are finding your site, what they're doing once they're there, and how they're moving through your conversion funnel.

The Life Cycle Reports
The Life cycle reports in GA4 are the most valuable because they provide insights into the entire customer journey, from acquisition to retention.
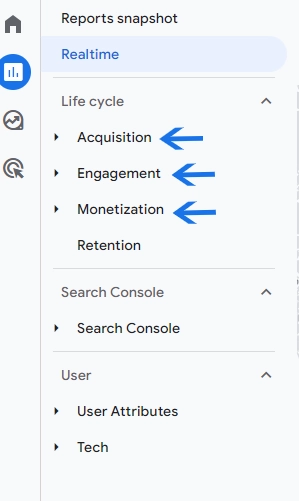
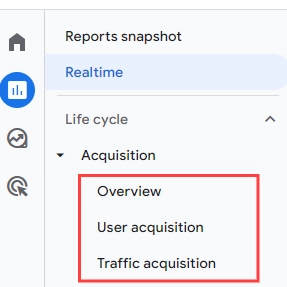
Acquisition reports: Will help provide insights about how visitors arrive to your website
These reports provide insights into how users find your website or app. They can help you identify your most effective marketing channels and optimize your acquisition strategy.
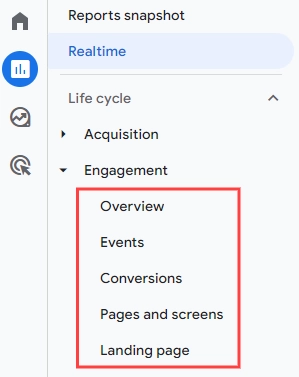
Engagement reports: Will help provide insights about specific actions they are doing after they arrive from your site.
These reports show you how users interact with your website or app. They can help you identify which pages or features are most popular and where users are dropping off.
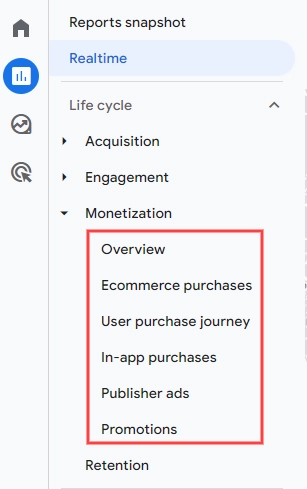
Monetization reports
These reports show you how users are generating revenue for your business. They can help you identify which products or services are most profitable and optimize your monetization strategy.
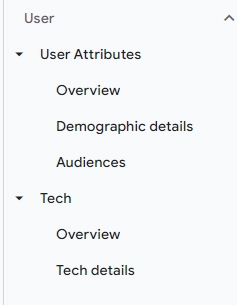
User Reports
This section of the GA4 reporting focuses on the demographics of your users, such as their age, gender, and location, and the technology they use to access your website or app, such as their browser, device, and operating system.
Best practices for using standard reports effectively
- Use annotations: Add annotations to your reports to document significant events or changes in your business that may have affected user behavior. Annotations help provide context to your data.
- Test and iterate: Continuously test different configurations, segments, and reports to refine your analysis and gain a deeper understanding of your users' behavior.
- Monitor data quality: Regularly check your GA4 data to ensure it's accurate and reliable. Address any tracking issues promptly to maintain the integrity of your reports.
Now that we have a basic understanding of the standard reports in GA4, let's explore how we can customize them to get the data we need.
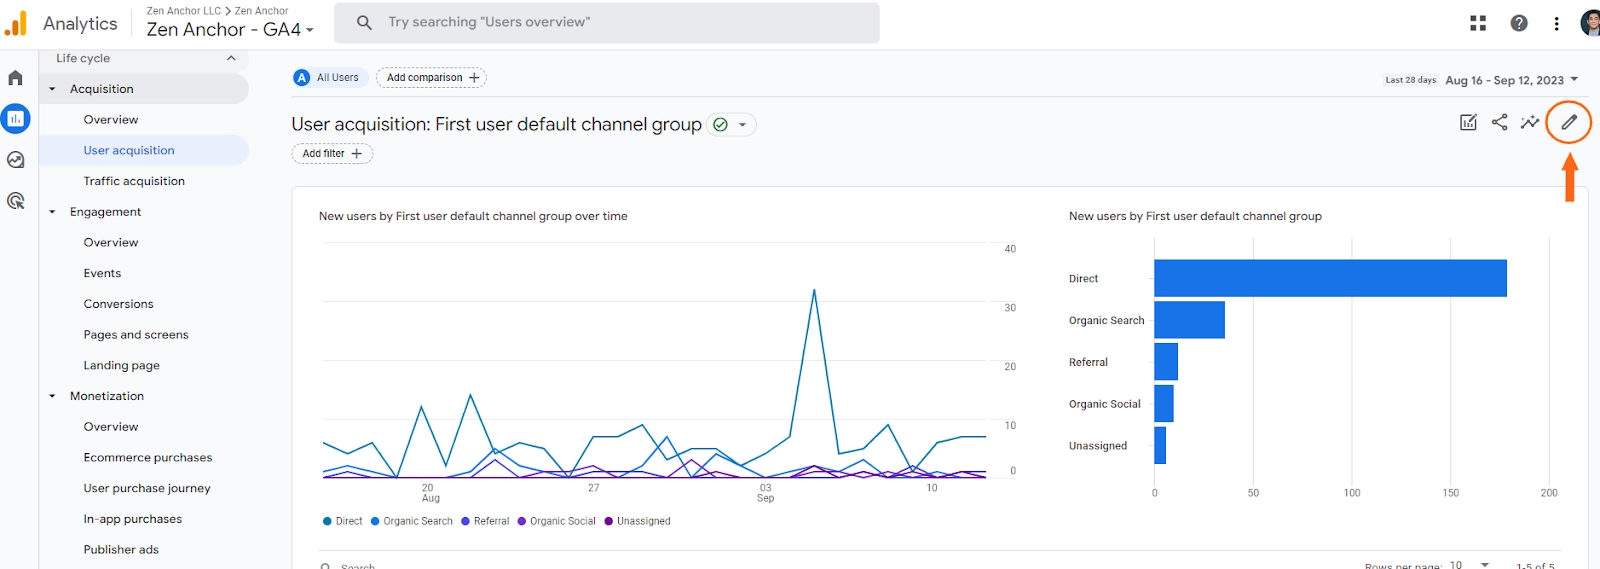
To customize a report, click on the customize report icon in the top-right corner of the report.
Customizing and Organizing Standard Reports
To customize a report, click on the customize report icon in the top-right corner of the report.
In the REPORT DATA , you can change the dimensions and metrics that are displayed in the report. You can also add filters to the report to narrow down the data that is displayed.
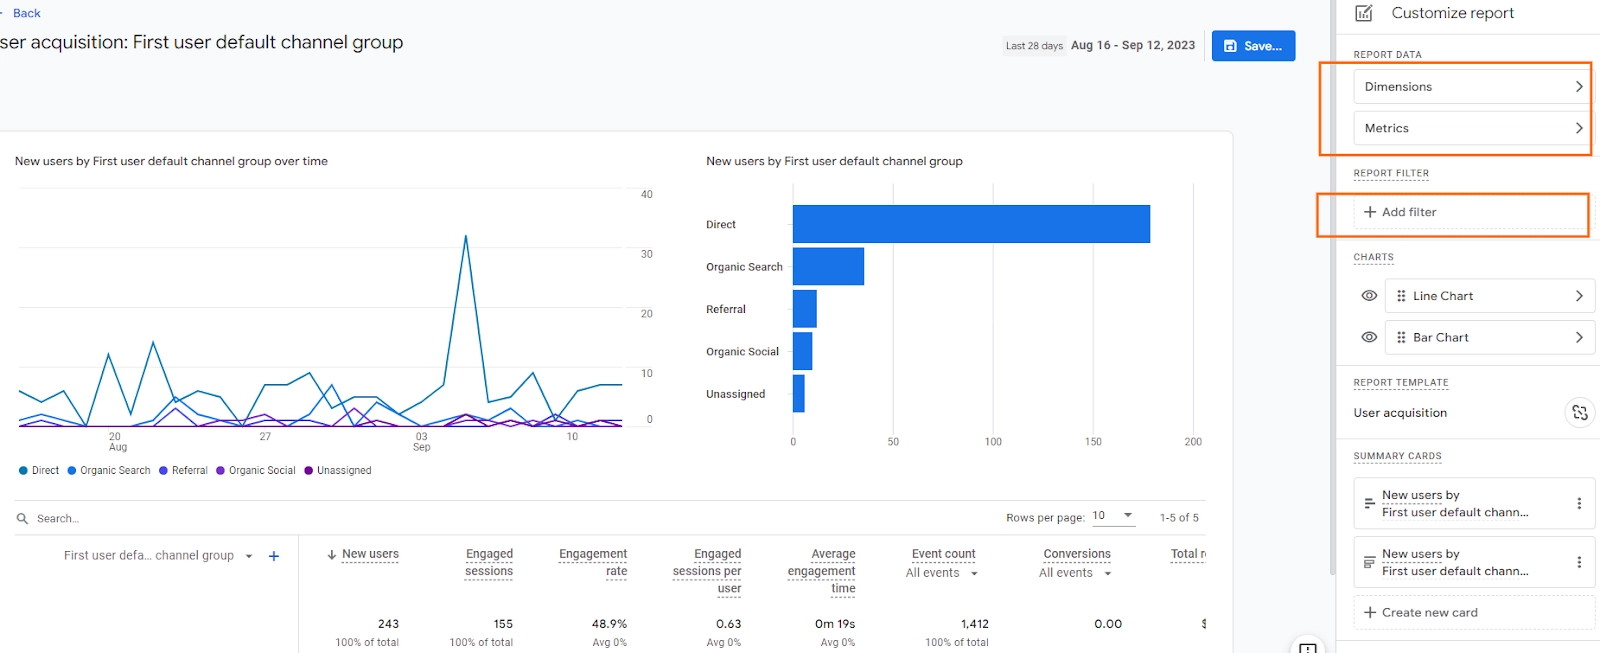
You can also hide charts by clicking on the eye icon next to the chart name.
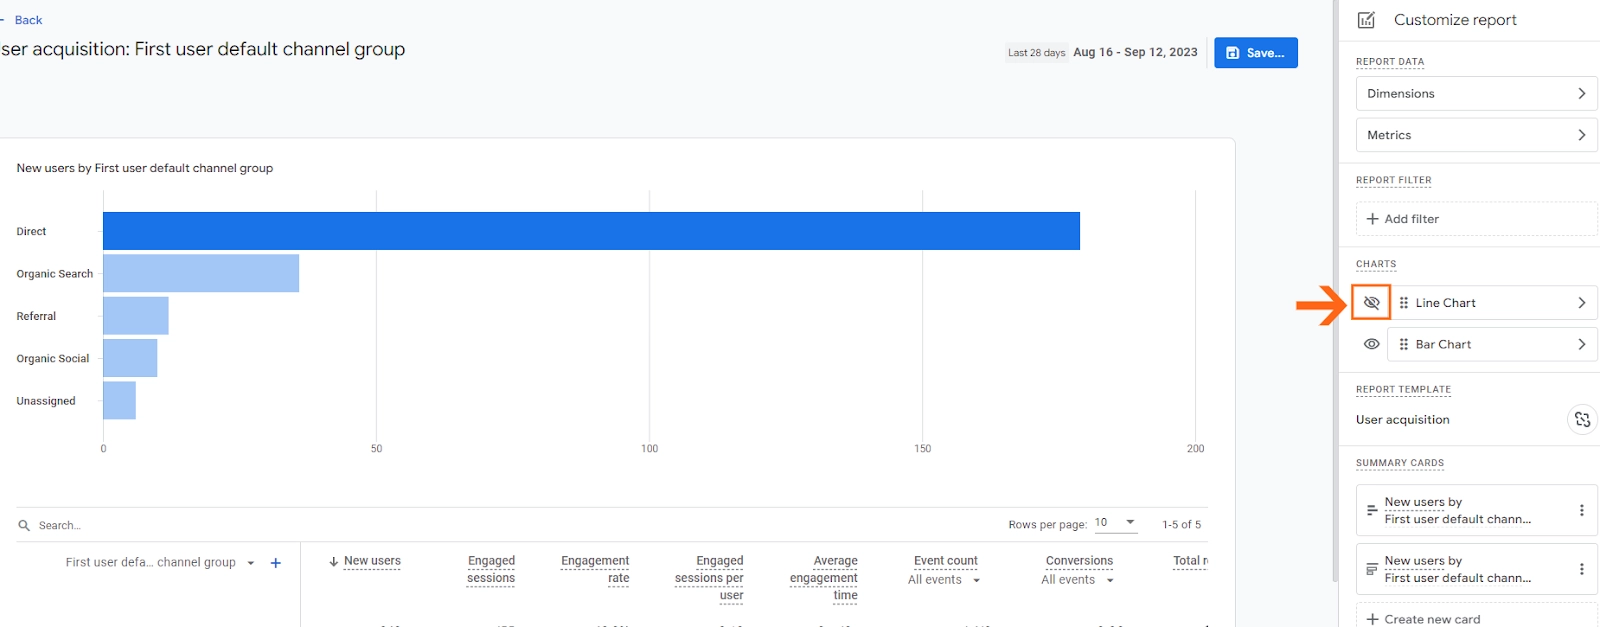
Once you click on the eye icon, the chart will be hidden from the report.
Adding and removing dimensions.
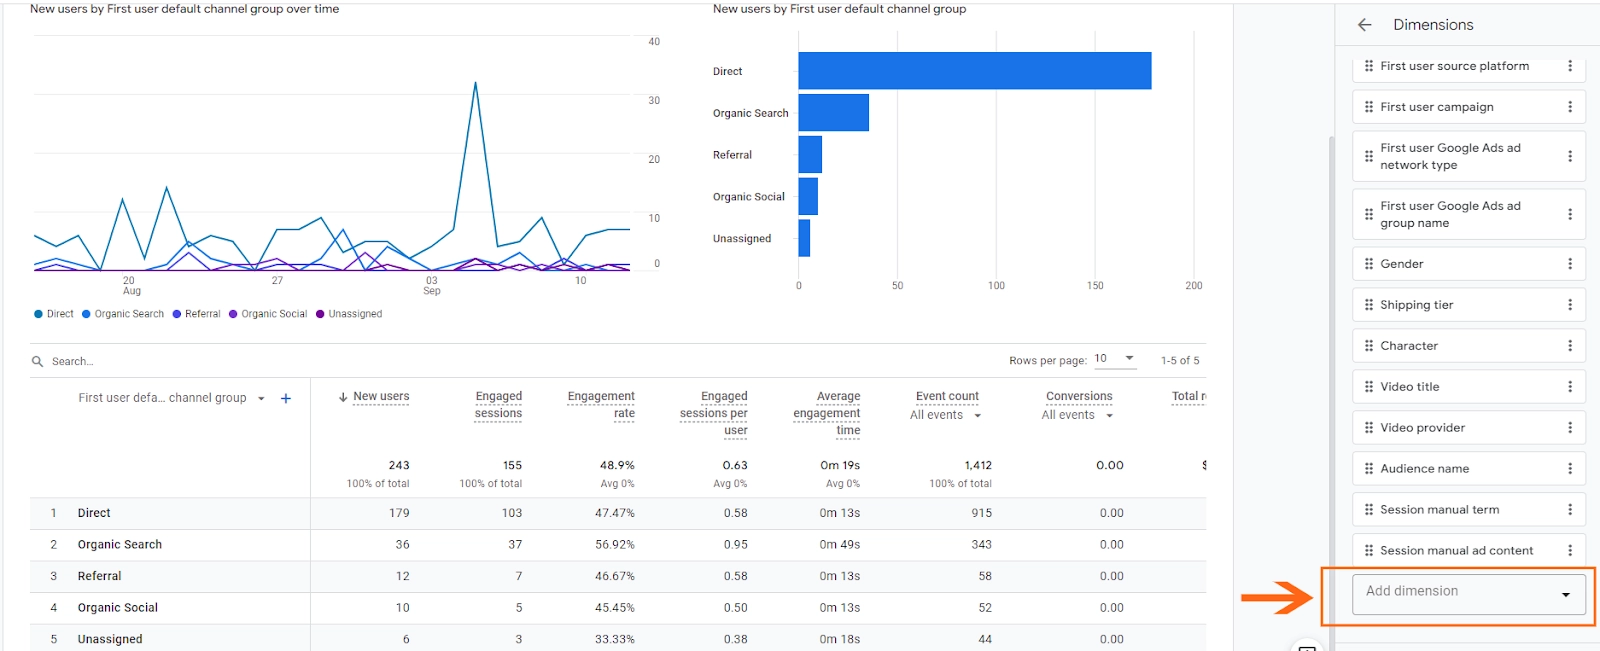
To add a dimension to a report, you can select it from the REPORT DATA section. Click Dimensions and then select the dimension that you want to add from the list at the bottom of the Dimension panel.
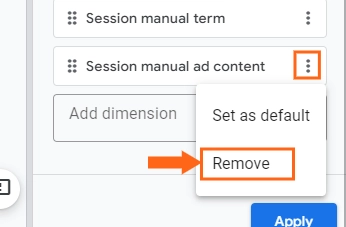
To remove a dimension from a report, simply click on the action icon (three dots) beside the dimension name and select Remove. Then hit Apply to save the changes.
Where to see this added dimension in the report. You’ll notice that dimensions you add are not seen automatically in the report. That is not how it works. So where can I find it? By Clicking the dropdown Icon from the tabular data, you’ll see all those dimensions that you’ve added from the dimension list.
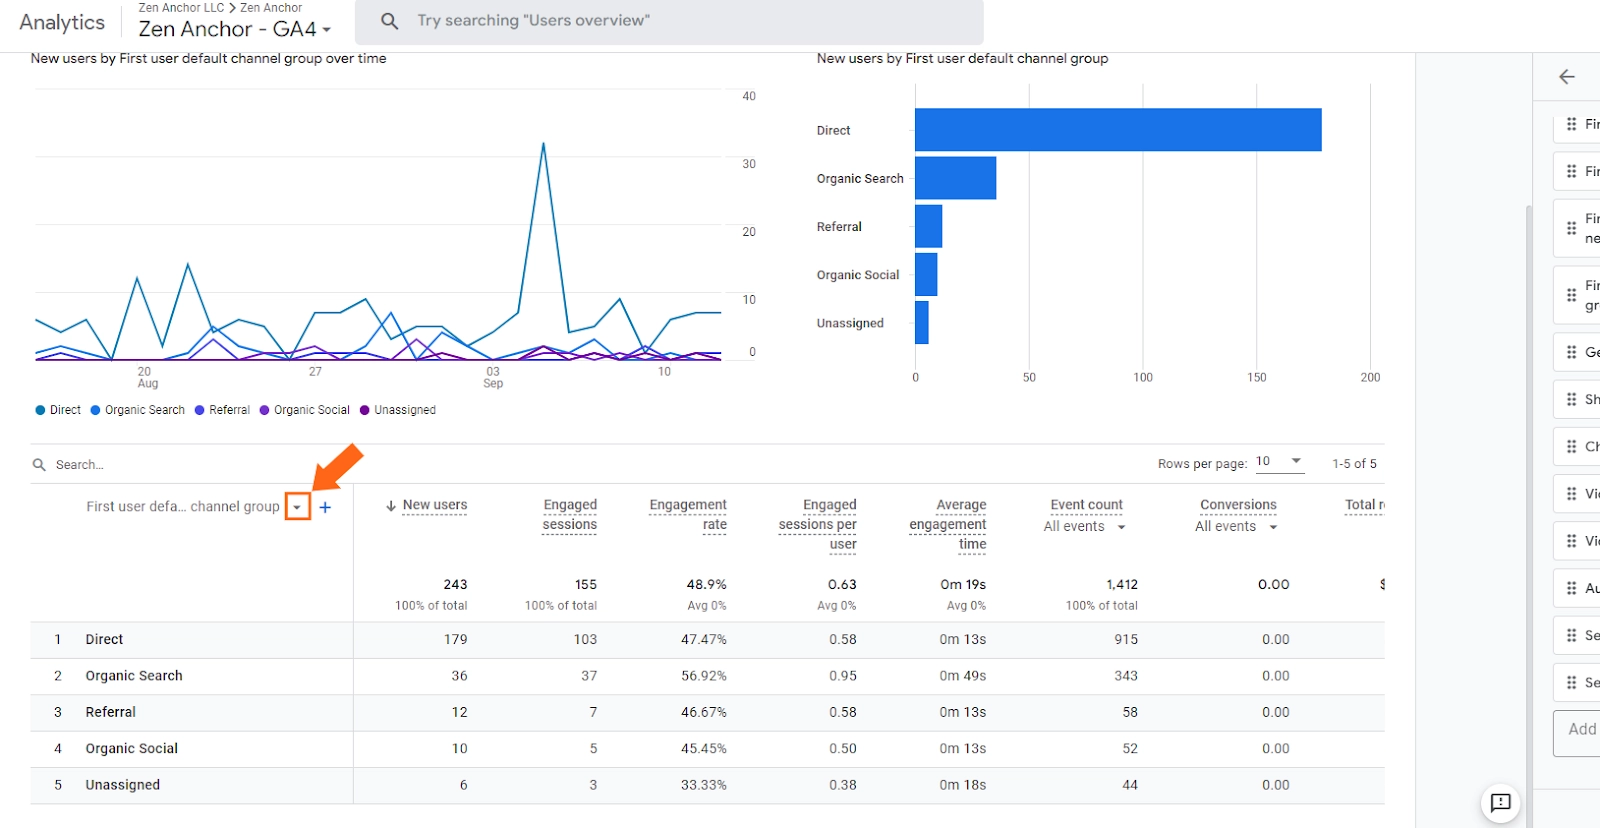
You can use the primary dimension drop-down menu to change the primary dimension from the tabular data. You can also click on the "+" icon to add a secondary dimension.
Adding, Removing and Organizing Metric
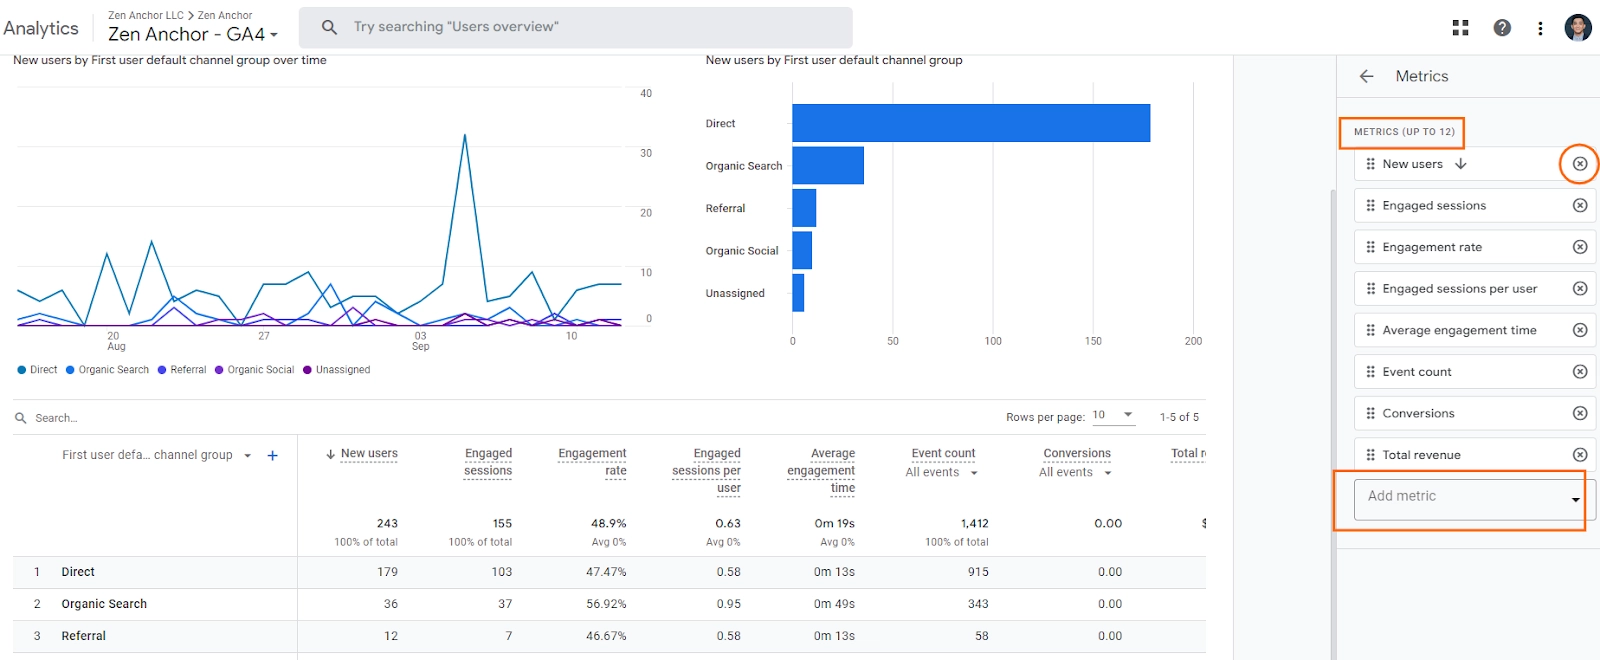
In the Report Data section, you can add metrics by clicking on the Metrics tab and selecting the metric that you want to add from the dropdown option at the bottom of the panel. You can also delete metrics by clicking on the "x" icon next to the metric name.
Note: You can only add up to 12 metrics to a report. You can also organize these metrics by dragging and dropping it to your desired position.
Finally if you’re happy with what you see in the reports, you can then go ahead and provide a name for the report and optional description. Then, click Save.
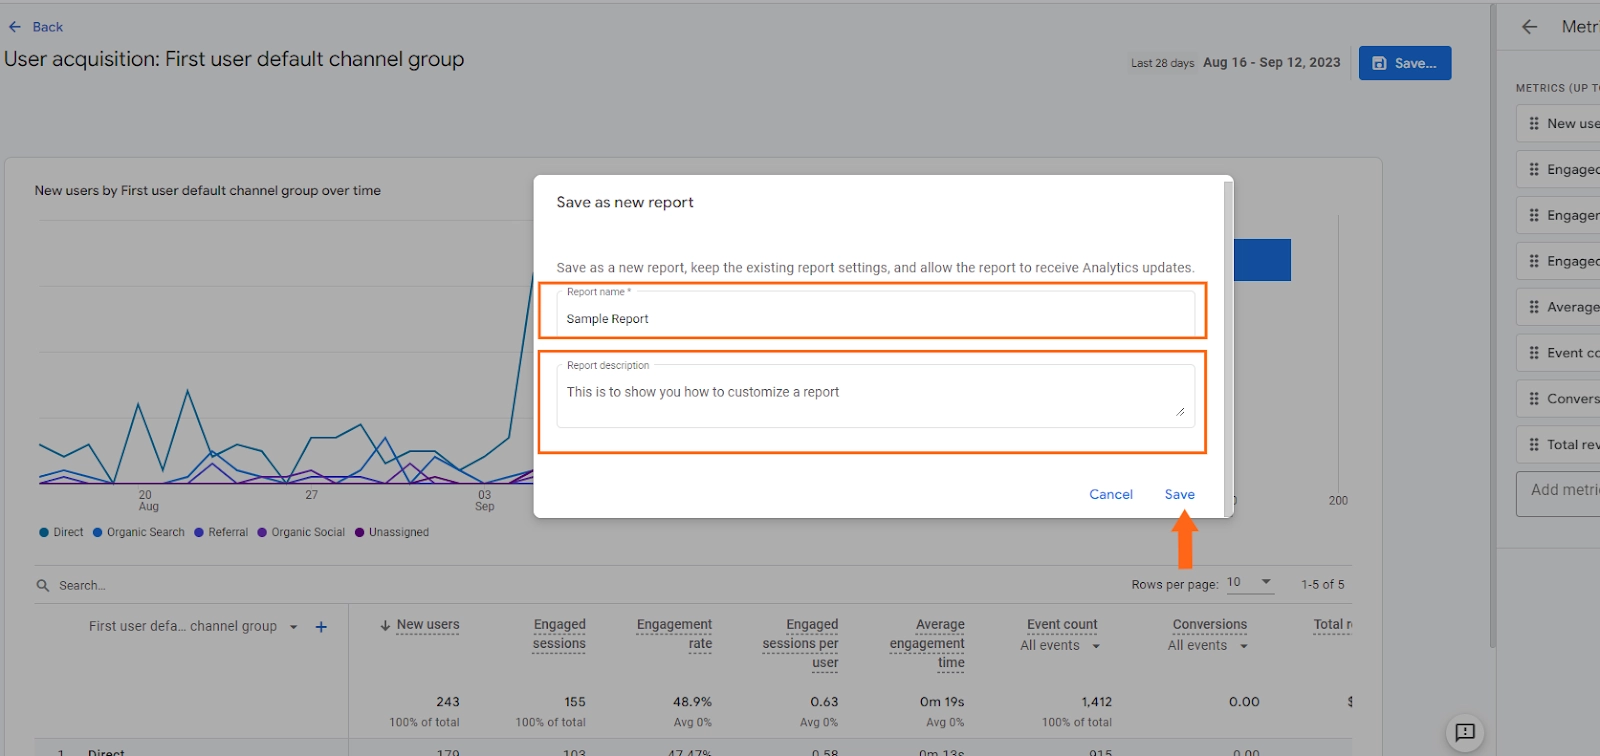
Note: You can choose to save the changes as a new report or save the changes to the current report. If you choose to save the changes as a new report, a new report will be created with the same name as the original report, but with the word "copy" appended to the end. If you choose to save the changes to the current report, the changes will be saved to the original report.
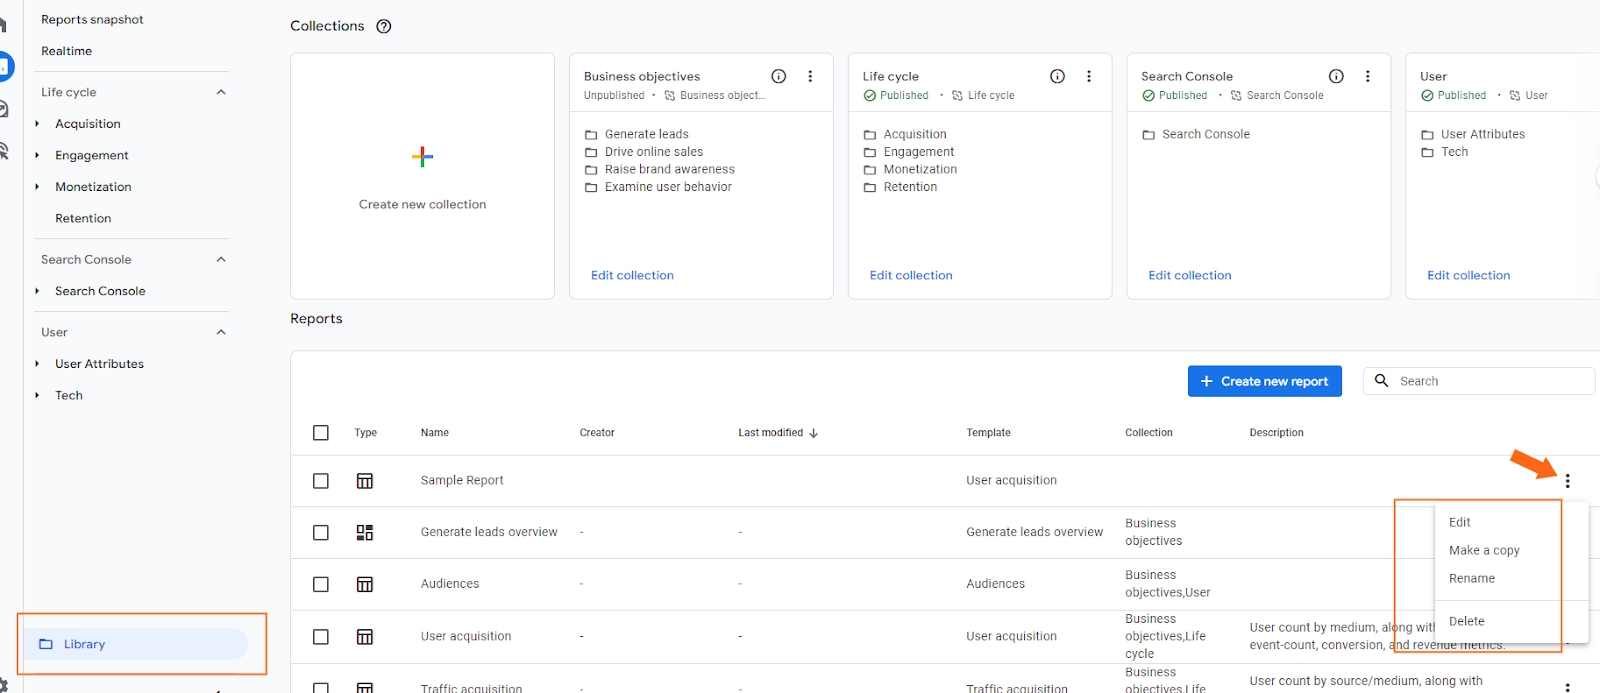
If you no longer need a report, you can delete it. To do this, go to Reports > Library and click on the action icon (three dots) next to the report name. Then, select Delete.
You can also choose other options, such as:
- Edit: To edit the report.
- Make a copy: To create a copy of the report.
- Rename: To rename the report.
Important Notes:
- If you see a "CARDS" header on the right instead of a "REPORT DATA" header, you are viewing an overview report. Overview reports provide a high-level summary of data, while detail reports provide more in-depth information. To view a detail report, click on the "REPORT DATA" header.
- You need to have Editor or Administrator access to have the ability to customize a report
- Google Analytics property can have up to 150 custom reports
Exporting and Sharing Standard Reports
This additional guide will show you how to share and download reports in Google Analytics 4.
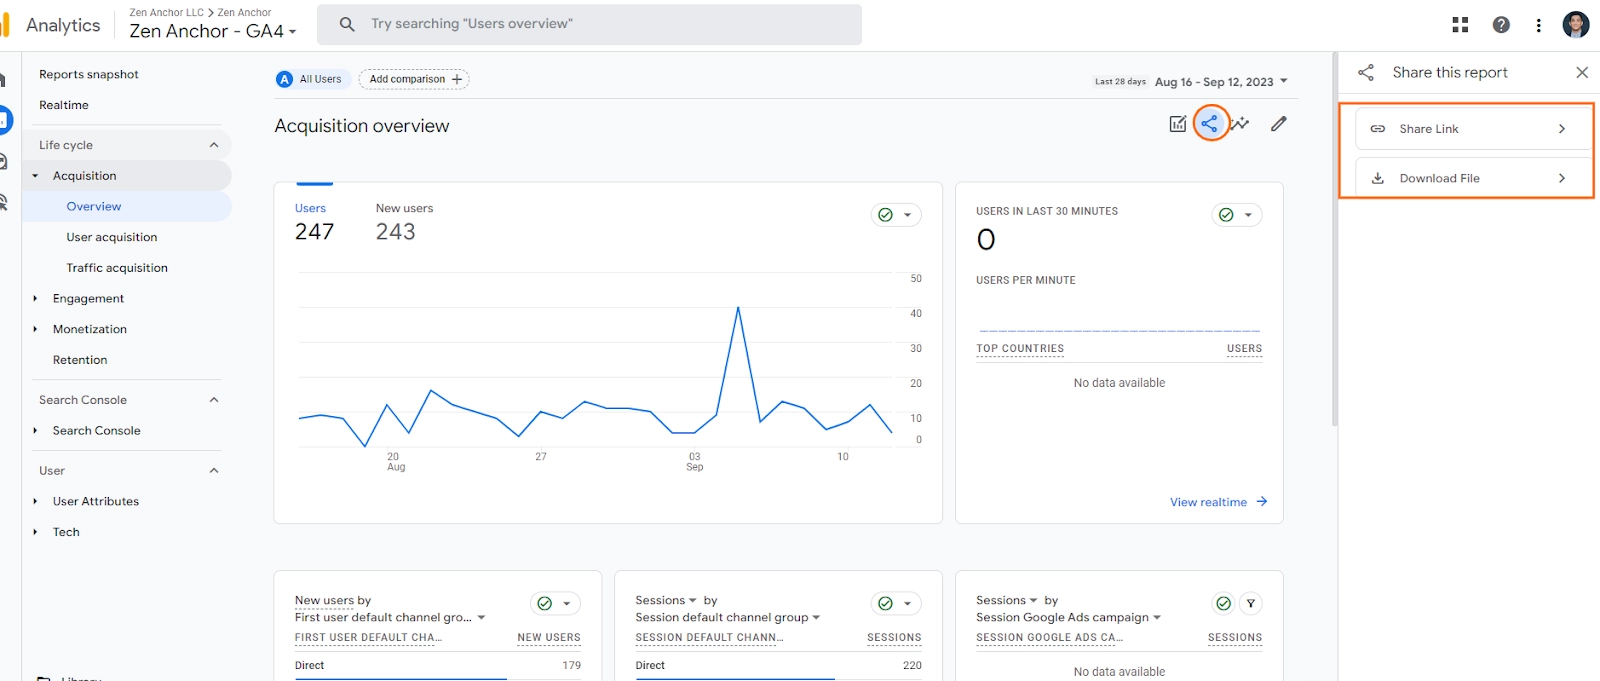
- To share a report, click on the share this report icon (shown in the screen grab below) and choose the options based on what you want to achieve.
- To download a report, click on the download icon and choose the desired format (PDF or CSV).
Tips for Creating Effective Reports
When creating standard and custom reports, there are a few things you can do to make them more effective. Here are a few tips:
- Start with your goals: What do you want to achieve with your reports? Once you know your goals, you can start to create reports that will help you achieve them.
- Use the right metrics: Choose the metrics that are most important to your goals. This could include metrics such as website traffic, conversion rates, and average order value.
- Visualize your data: Using charts and graphs can help you visualize your data and make it easier to understand.
- Share your reports: Share your reports with the people who need to see them. This could include your marketing team, sales team, and product team.
Frequently Asked Questions
Are there limitations to custom reports in GA4?
Answer: While custom reports offer significant flexibility, they do have some limitations. For example, there is a limit to the number of metrics and dimensions you can include in a single custom report. Additionally, some advanced features like cohort analysis may not be available in custom reports.
Can I schedule custom reports to be delivered to my inbox regularly?
Answer: Google Analytics 4 (GA4) does not yet support scheduled reports to be delivered to your email inbox on a regular basis. However, one way to do this is to use Google Looker Studio. Looker Studio is a data analytics platform that allows you to create custom reports and dashboards. You can recreate the report that you want to schedule in Looker Studio and then set up a scheduled email delivery for the report.
How often should I review and update my custom reports in GA4?
Answer: It's a good practice to review and update your custom reports regularly, especially when your business goals, website structure, or marketing strategies change. This ensures that your reports continue to provide relevant and actionable insights.
What are the next steps?
Setting up standard and custom reports in Google Analytics 4 is an important step in understanding your website traffic and user behavior. By following the tips we shared, you can create effective reports that will help you improve your website and marketing campaigns. If you want to learn more about how you can use other reporting features, we’d like to invite you to check out this blog post about how to Explore and use the Exploration report.
Final Word
Remember, the data is only as good as the insights you derive from it. So make sure to take the time to analyze your reports and identify opportunities to improve. And don't forget to share your reports with the people who need to see them.
We're always looking for ways to improve our Google Analytics 4 blog content. Please share your feedback so we can make it even better.
See Article Images


