


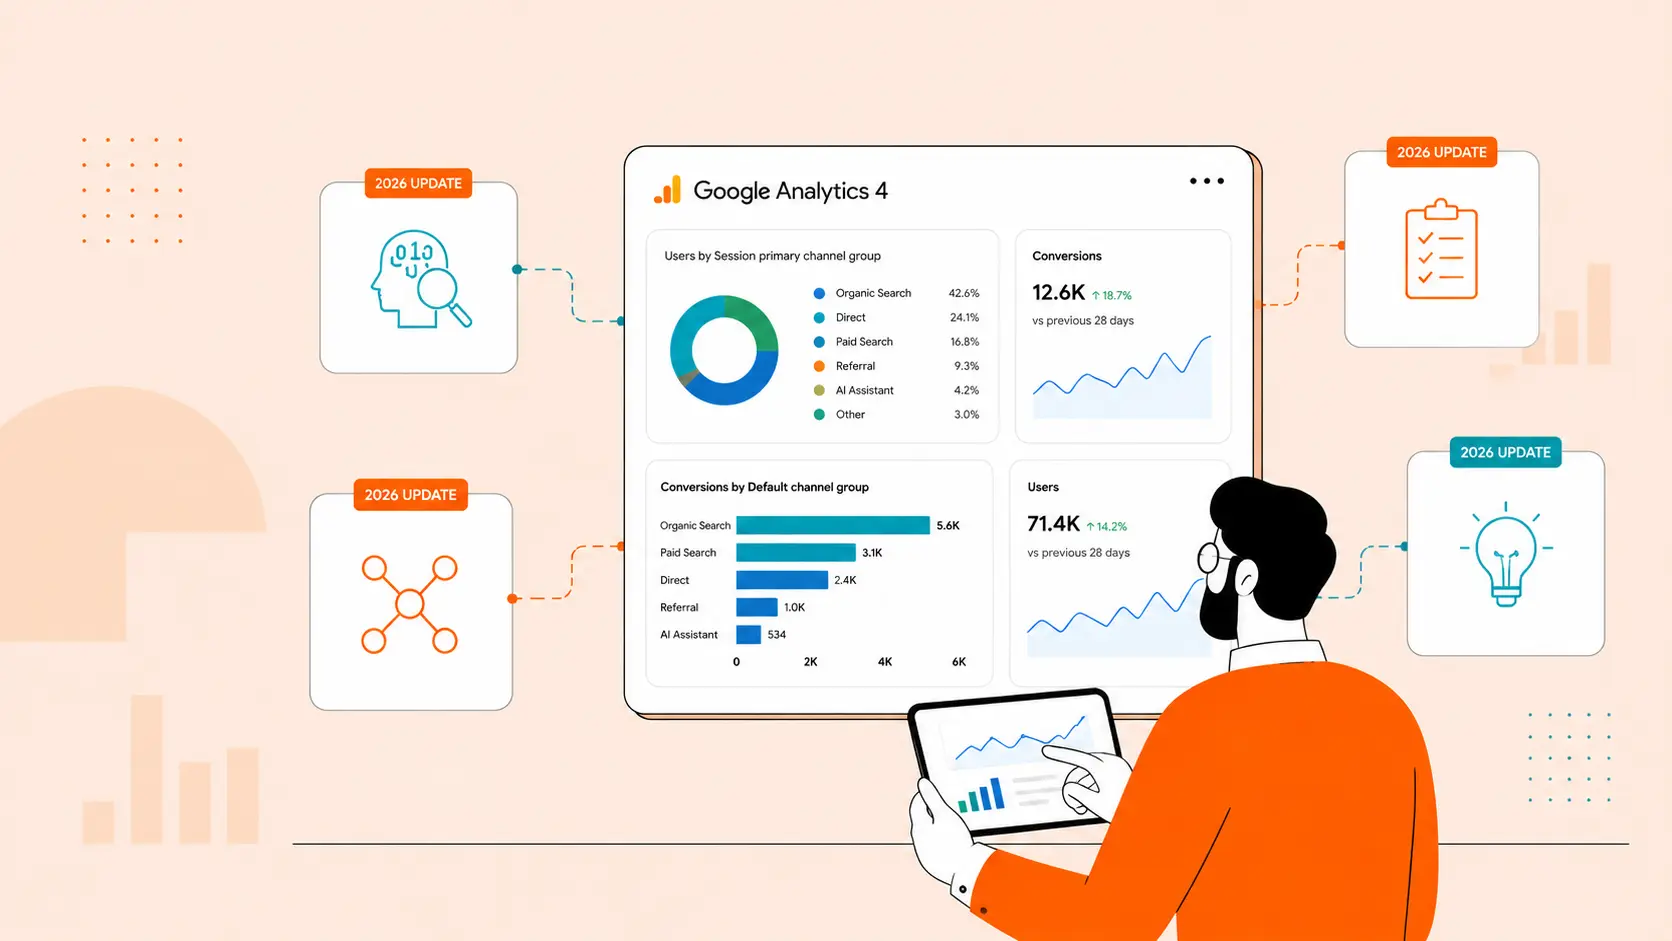


What is automated reporting in Google Analytics 4?
Automated reports are a powerful feature of GA4 that allows users to generate comprehensive and insightful reports without any manual effort. These reports are generated based on pre-defined templates and can be customized to meet specific needs. Automated reports or automated insights as it’s known to most digital marketers can be scheduled to run at set intervals, ensuring that users always have access to up-to-date information.
Why is automated reporting important?
Identify trends and patterns: Automated insights can help you to identify trends and patterns in your data that you might not have noticed otherwise. For example, they can alert you to sudden spikes or dips in traffic, changes in user behavior, or new opportunities for growth.
Save time and effort: Manually analyzing large amounts of data can be time-consuming and difficult. Automated insights can save you time and effort by doing the analysis for you and presenting you with the most important findings in a clear and concise way.
Make better decisions: By understanding the trends and patterns in your data, you can make better decisions about your marketing and business strategy. For example, you might use automated insights to identify which marketing campaigns are most effective, or to make changes to your website that will improve user experience and conversion rates.
Looks like you’re getting interested, let's get down to the nitty-gritty of how it's done…
How to create automated reports in Google Analytics?
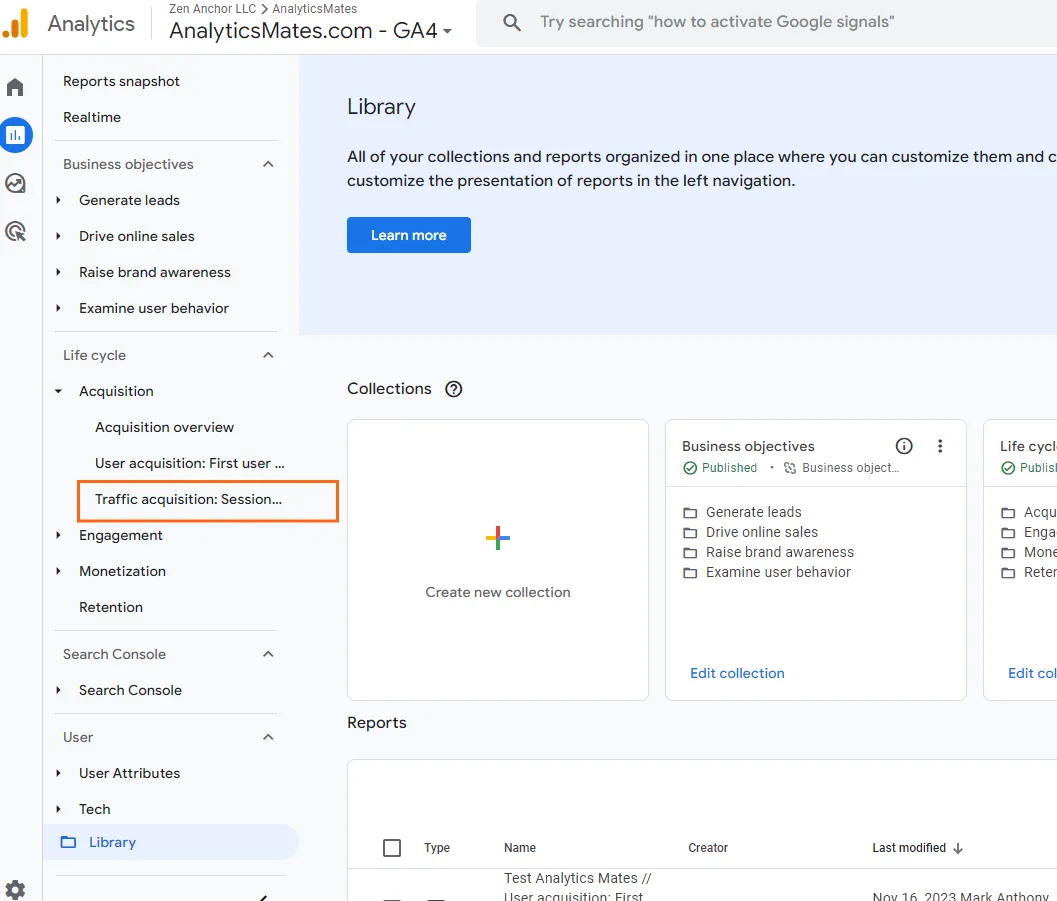
1. Navigate to the "Reports" section in the left-hand menu of your Google Analytics dashboard. Upon reaching the Reports page, choose the reports that you want to customize and generate. In this example let’s use a Traffic Acquisition report.
2. Click the pencil icon at the top right corner of the page.

3. Specify the parameters and indicators by selecting the appropriate metrics and data ranges. For more in-depth customization, explore the advanced settings and configure additional properties.
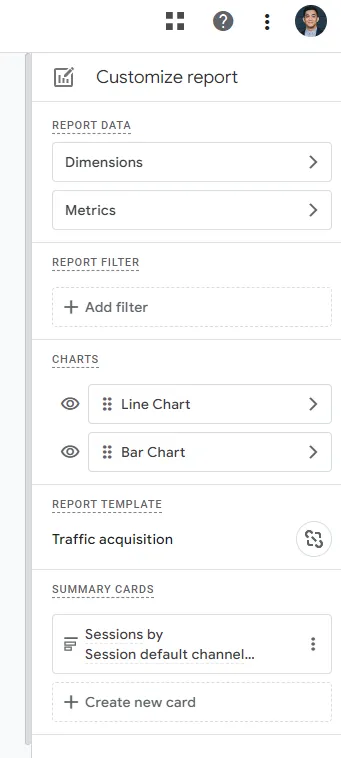
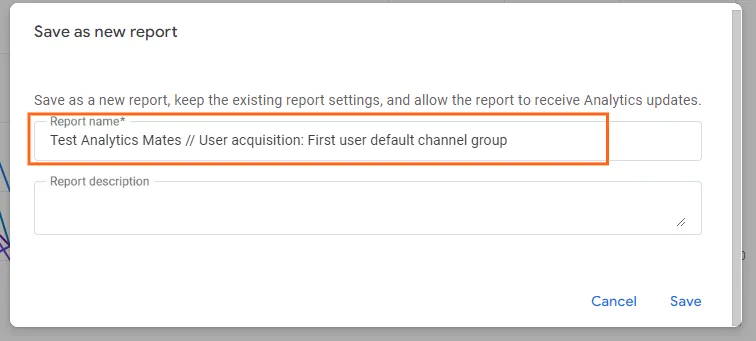
4. Once you’re confident on the report you can save it. GA will give you two options to save it. 1) Save changes to the current report, and 2) Save as a new report.
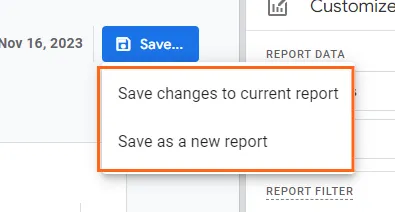
5. Give a good name and click “Save”.
6. To access this report you can go to the Library section. Look up for the report.
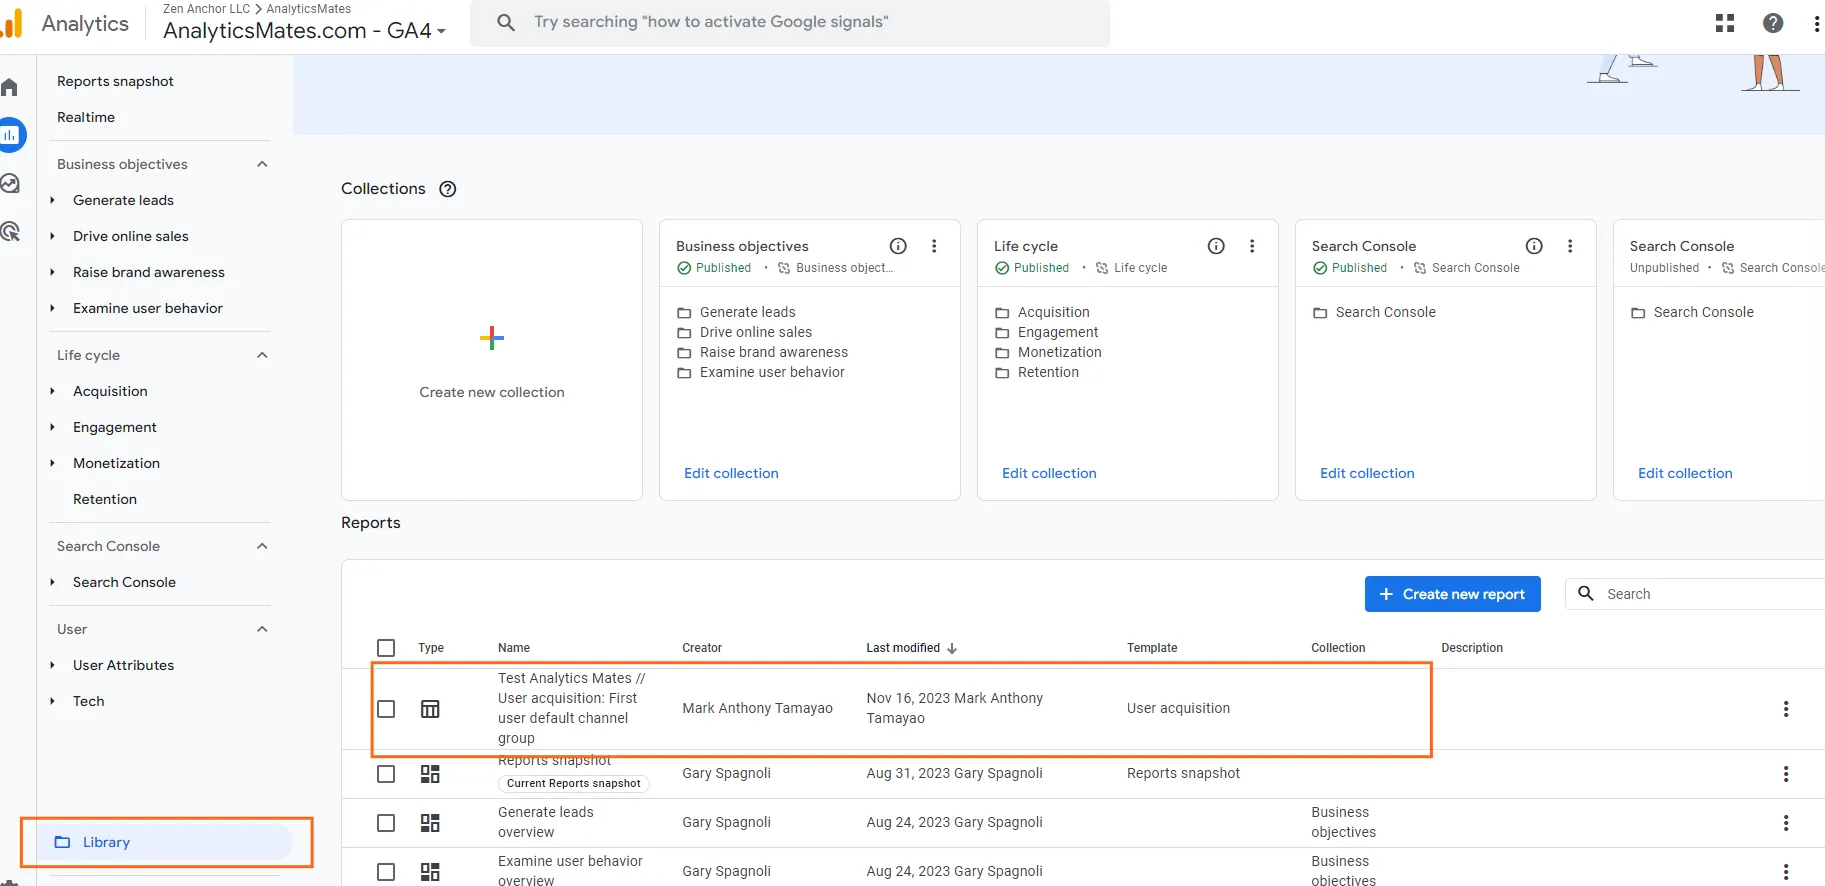
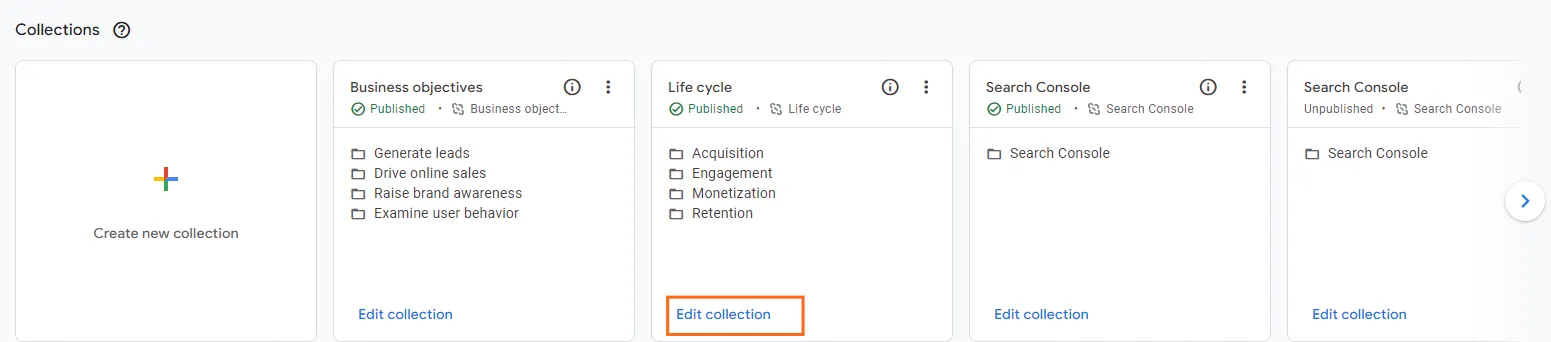
7. Now the next step would be to add that report to the Collections section. Click “Edit collection” to where you want to add the customized report.
8. You'll be presented with two panels. Simply drag and drop the customized report from the right panel to the left panel. Once you’re done, click Save.
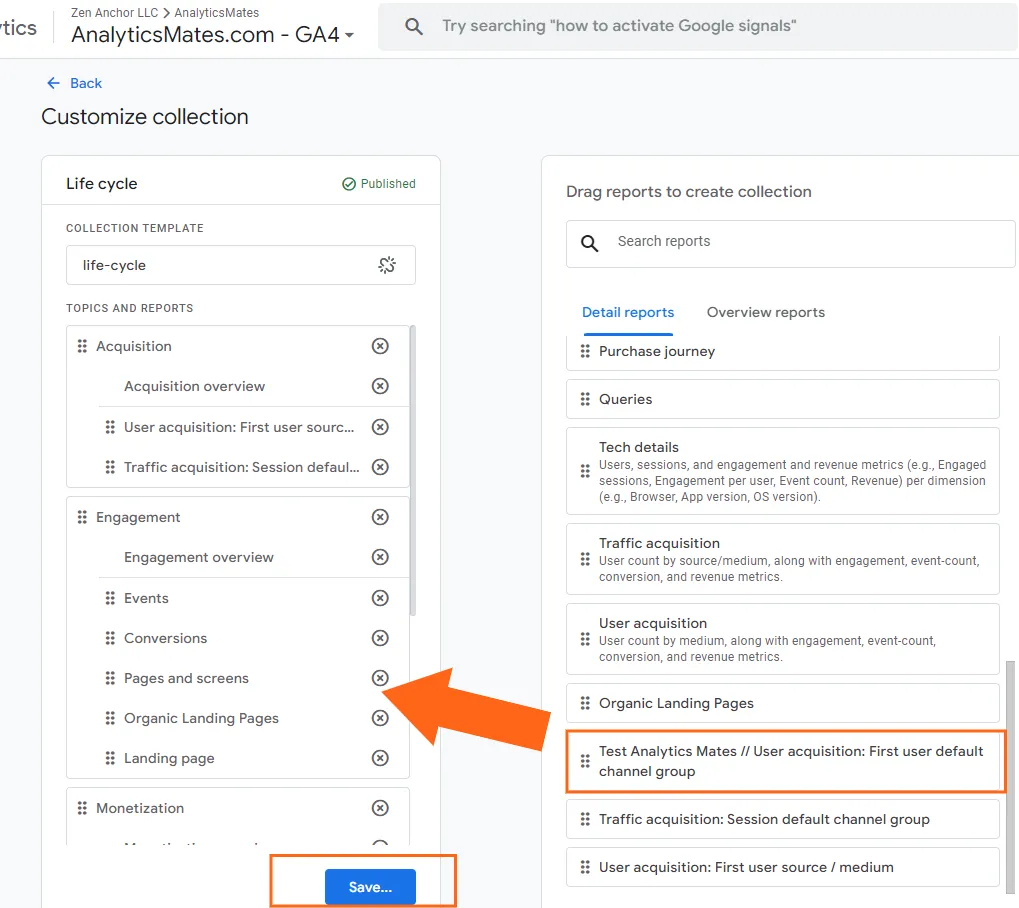
9. Go back to the Reports section. Now, you'll have that report included in your current standard reports.

That’s it! We’ll now move on to the next step and that is how to send this report automatically to specific recipients in the next section.
How to share automated reports in Google Analytics?
After creating a custom report based on your needs, we’ll explore how you can automatically send that report to specific recipients.
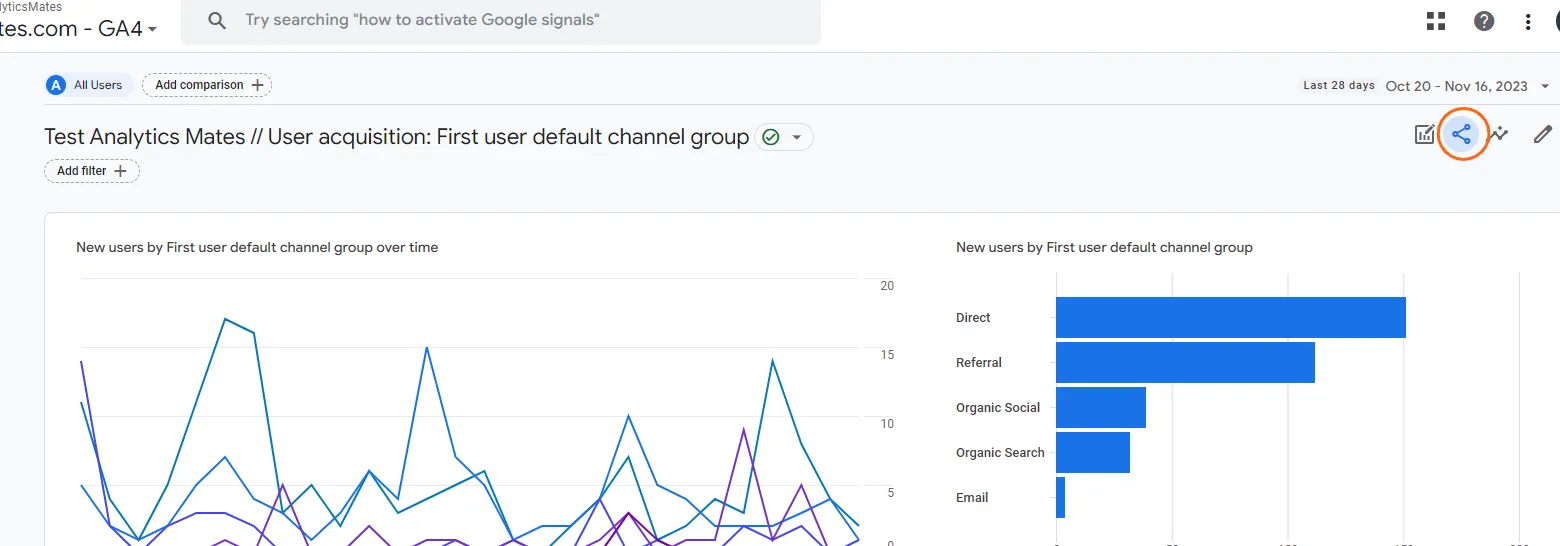
- Once you’re in the report, click the share icon button.
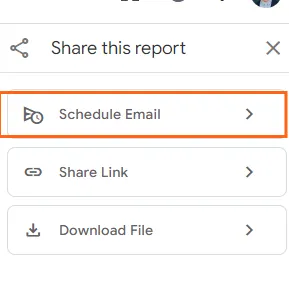
- From the Share this report section you’ll have three options. That is 1) Schedule Email 2) Share Link and 3) Download File. Click on the Schedule Email.
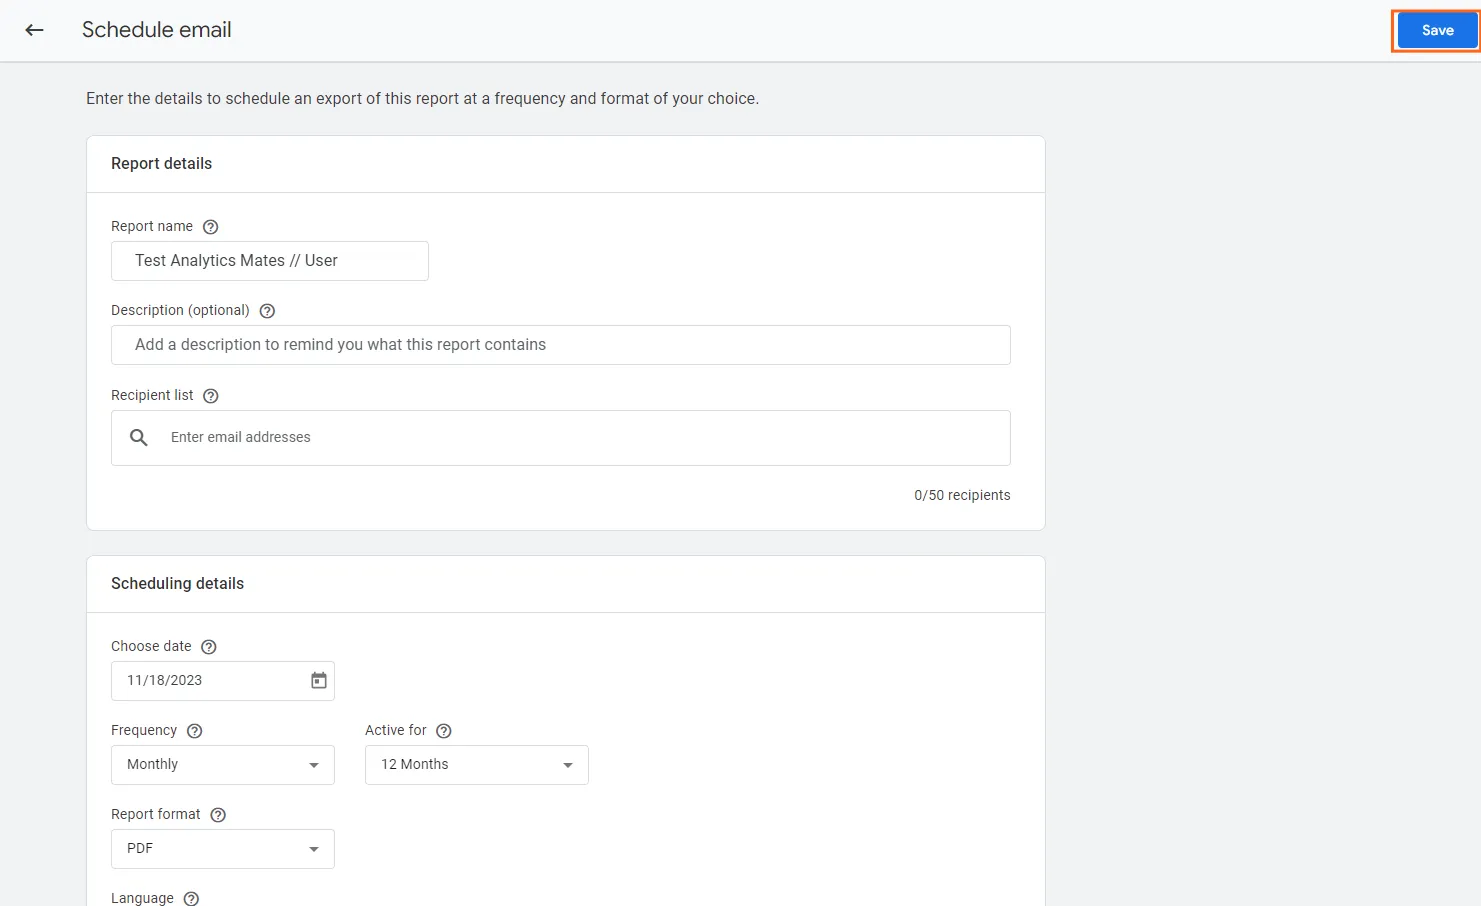
- Set your schedule email options based on your preferences. Once you’re confident on your settings, you can click Save.
If you reach this section, you’re all set to go! Remember, sharing automated reports in Google Analytics is like giving your team a constant supply of fresh insights, delivered right to their inbox. By setting up scheduled reports and customizing sharing options, you can ensure that everyone has the information they need to make informed decisions and drive business growth. So, go ahead, share those reports and let the data do its magic!
Tips for creating effective automated reports in GA4
1. Use Clear and Concise Titles for Your Reports
The title of your report should be clear and concise, accurately reflecting the content of the report and making it easy for recipients to identify its purpose at a glance. A well-crafted title should be no more than a few words long and use descriptive language that accurately conveys the key metrics or dimensions covered in the report.
For example, instead of simply naming a report "GA4 Report," consider using a more informative title like "Weekly User Acquisition Report for Analytics Mates".
2. Include Relevant Metrics and Dimensions in Your Reports
The metrics and dimensions you include in your reports should be directly relevant to the specific objectives of the report and the needs of the target audience. Avoid cluttering reports with unnecessary data that may obscure key insights or distract from the primary focus.
Carefully select metrics that provide valuable insights into user behavior, website performance, or marketing campaign effectiveness. Choose dimensions that allow you to segment your data and gain a deeper understanding of specific segments of your audience.
3. Use Filters to Segment Your Data and Create More Targeted Reports
Filters are powerful tools for segmenting your data and creating more targeted reports that focus on specific aspects of your website or app performance. By applying filters, you can isolate specific user groups, campaigns, or time periods to gain a more granular understanding of trends and patterns.
For instance, you might use a filter to isolate traffic from a particular marketing campaign to assess its effectiveness or use a filter to segment users by location to identify regional preferences or trends.
4. Use Annotations to Highlight Important Trends and Insights
Annotations allow you to add contextual notes and explanations to your reports, highlighting important trends, anomalies, or insights that may not be immediately apparent from the data alone. Annotations provide a valuable way to draw attention to key takeaways and ensure that important observations are not overlooked.
Use annotations to explain sudden spikes or drops in traffic, highlight significant changes in user behavior, or provide context for anomalies in your data. Annotations can also be used to document changes you've made to your website or marketing campaigns, allowing you to track the impact of these changes over time.
5. Share Your Automated Reports with Key Stakeholders
Once you've created effective automated reports, it's crucial to share them with the relevant stakeholders within your organization. This could include marketing teams, product managers, executives, or anyone who has a vested interest in understanding the performance of your website or app.
By sharing your reports, you can ensure that everyone has access to the latest data and insights, enabling them to make informed decisions based on data-driven evidence. Regularly sharing reports can also foster a culture of data-driven decision-making within your organization.
Frequently Asked Questions
How does GA4 generate automated reports or automated insights?
GA4 uses machine learning algorithms to analyze your data and identify patterns, trends, and anomalies. It then generates insights that are relevant to your specific business and website or app performance.
What are other tools that I can use to automate GA4 reporting?
Google Looker Studio (f.k.a Data Studio): It is a free reporting tool from Google. You can use Looker Studio to create automated reports that are based on your GA4 data.
Supermetrics: This is a reporting platform that allows you to connect to a variety of data sources, including GA4. You can use the tool to create automated reports that are sent to you via email or Slack.
How can I get help with using automated reports or automated insights?
There are several resources available to help you with using automated reports or automated insights, including:
- The Google Analytics Help Center
- Online forums and communities
- Just shoot us a message if you have any questions, and we'll be happy to assist you! :)
Final Word
So, there you have it, folks! Automated reports in Google Analytics 4 are like having a data sidekick that keeps you in the loop with all the latest insights from your website or app. By setting up automated reports, you can ditch the manual reporting grind and stay focused on making data-driven decisions that drive your business forward.
Remember, data is like a treasure trove of hidden gems, and automated reports are the key to unlocking them. So, embrace the automation revolution and let Google Analytics 4 help you transform your data into actionable insights, propelling your business to new heights of success.
Thank you for reading!
We're always looking for ways to improve our Google Analytics 4 blog content. Please share your feedback so we can make it even better.
See Article Images


