


Data captured by Google Analytics or any other reporting platform can have limitations when it comes to visualization. And visuals are vital to marketers and analysts, especially when they need to show data to their clients to make it easier to understand. This is where the Google Data Studio dashboard comes in.
With Google Data Studio, marketers and analysts can create dashboards to visualize the data they’ve gathered better.
Step-by-Step Guide to Creating Google Data Studio Dashboard
This step-by-step guide will teach you how to create a Data Studio Dashboard from scratch.
Create an Account or Sign In
1. The first step is to Create an Account or Sign in to Data Studio.
2. Navigate to the top left, click Create, then select Report.
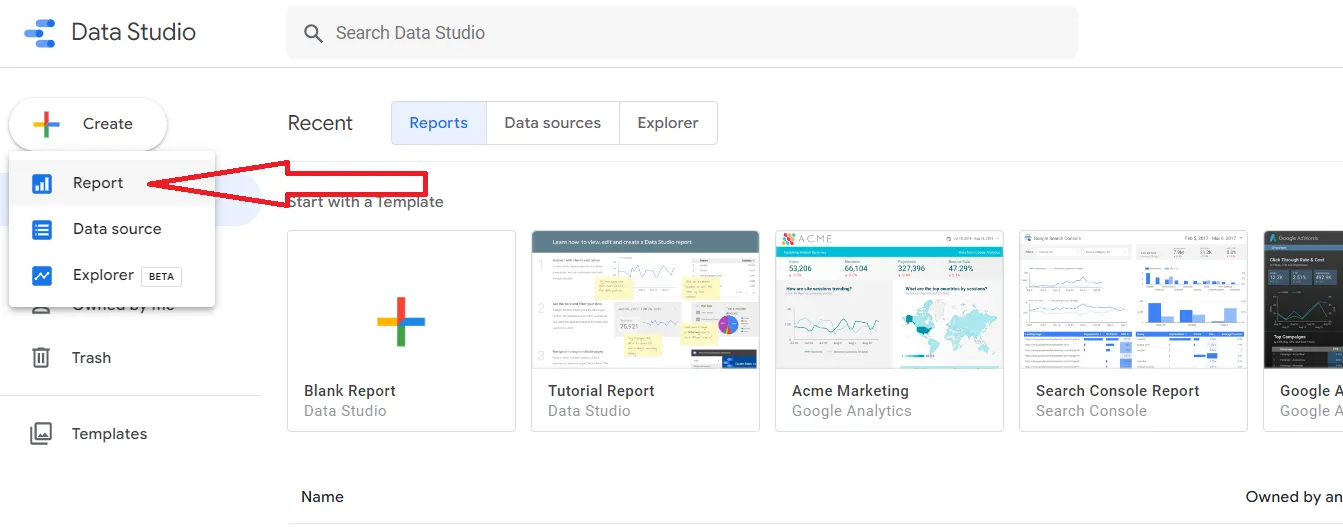
3. From here, you'll see the report editor tool, with the Add Data to Report panel open, showing 2 tabs: Connect to data and My data sources.
Connect a Data Source
1. In the Connect to data tab, choose a connector, create a new data source, and add that to your report
You may add different types of data sources and combine data sources when needed.
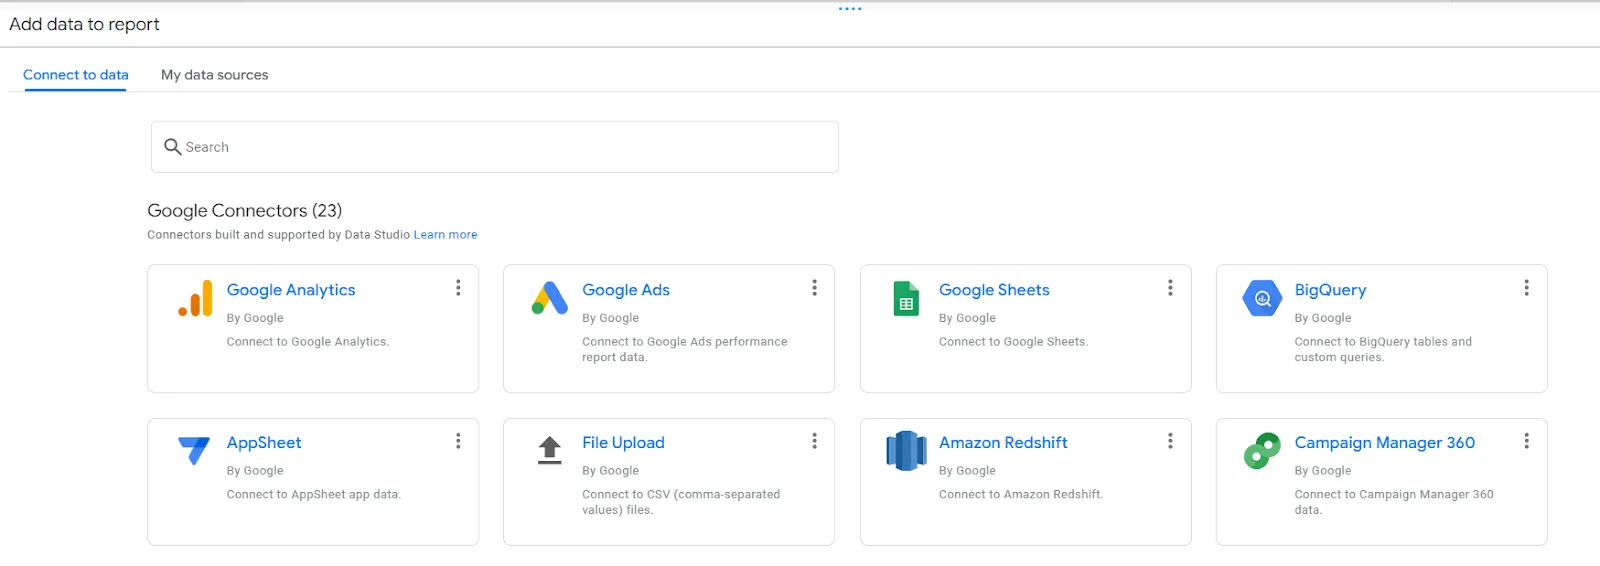
2. Select the type of data you want to visualize(e.g. Google Analytics)
3. Provide your account or other details.
4. In the bottom right, click Add.
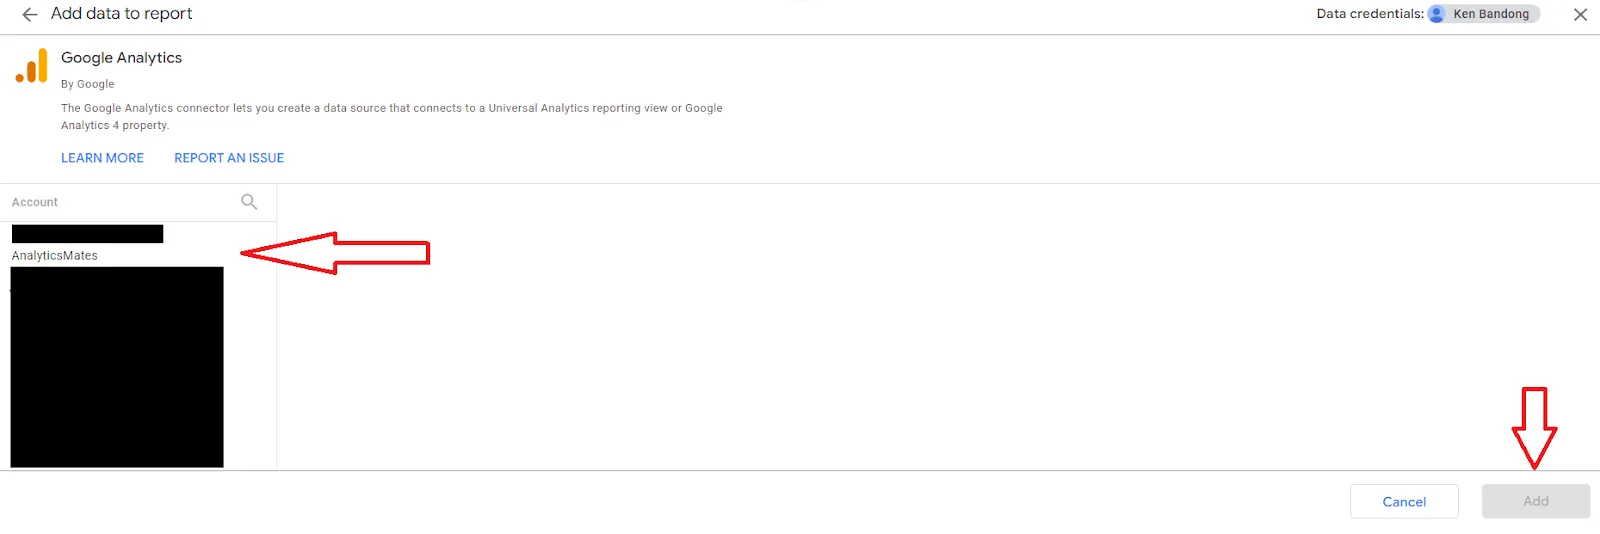
5. A table appears with fields from that data source.
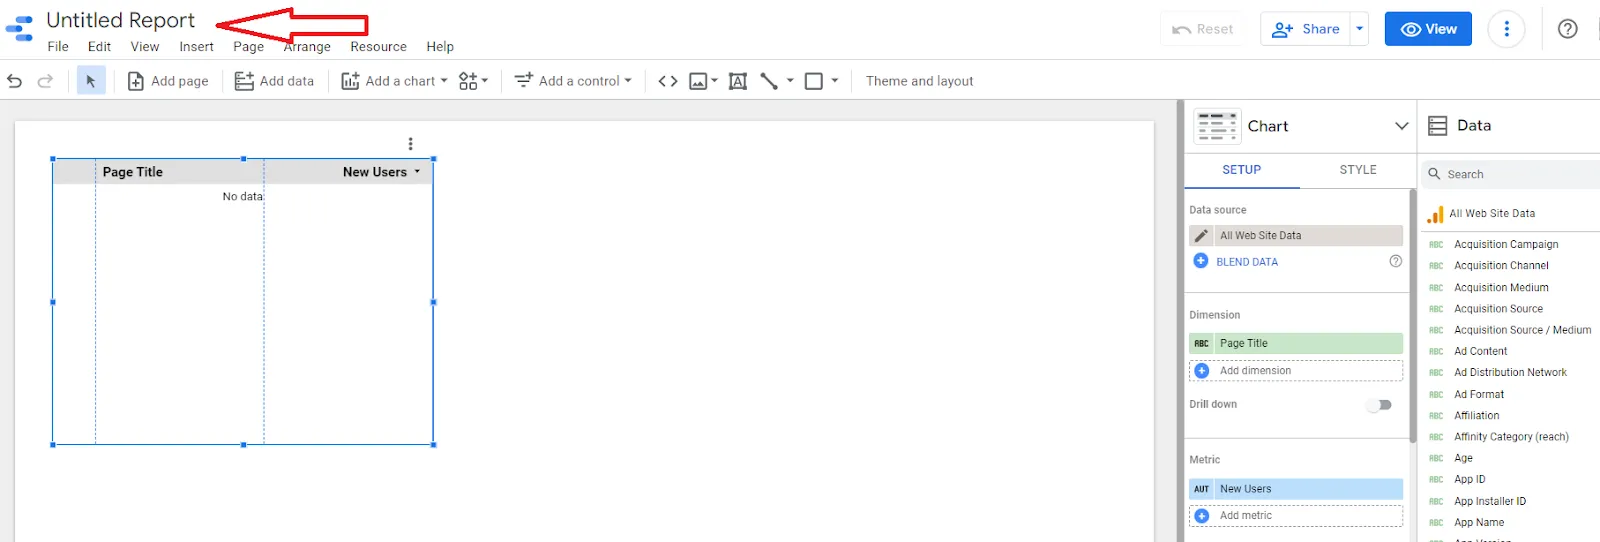
Rename Your Dashboard
In the top left, name your report by clicking Untitled Report and then entering a new name.
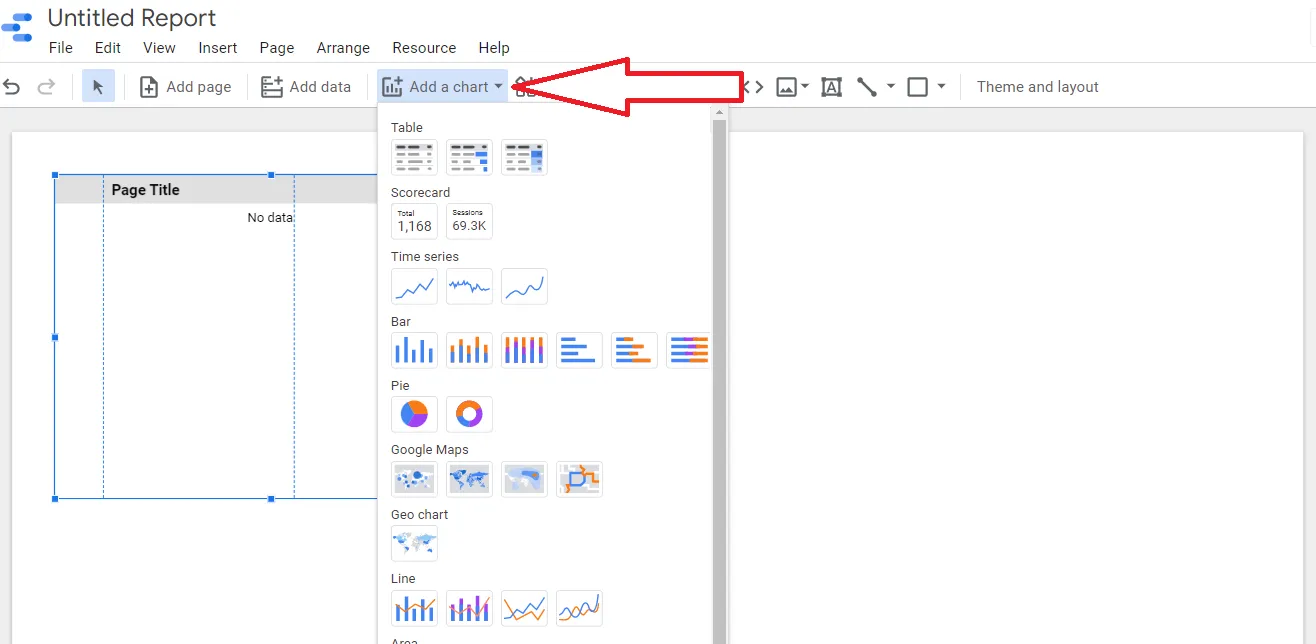
Add Charts
To add charts, navigate to the page that will contain the chart.
1. In the toolbar, click Add a chart.
2. Select the chart you want to add depending on what best suits the data you want to visualize.
3. Click the canvas to add the chart to the report. From here, you may add the dimensions and metrics that correspond to the data you’d like to visualize.
4. Select one or more charts to move or resize them as needed.
From here, you may add several charts that best suit your business needs. You may also edit and design the dashboard depending on your preference.
It may take some time to familiarize yourself with Google Data Studio, but it’s worth it. The best part is, using this tool comes at no cost.
See Article Images


