
In this blog post, we are going to talk about the different Google Analytics 4 (GA4) attribution reports. These reports help you understand how your marketing moves lead to people taking action on your website.
Imagine a user seeing your ad, then visiting your blog, and finally buying something. Attribution reports figure out which marketing steps helped make that happen! This post is your guide to understanding various GA4 reports and the valuable insights they bring. So, let’s jump right in and explore the GA4 attribution reports!
Different Attribution Reportings in GA4
We’ve tackled the different types of GA4 attribution models and the practical implementation. Now, let’s look at the reports that show this information. There are two types: Model Comparison and Conversions Path reports.
Model Comparison Report
Note: Leverage the Model comparison report to assess the impact of varying GA4 attribution models on the value of your marketing channels.
Access the report
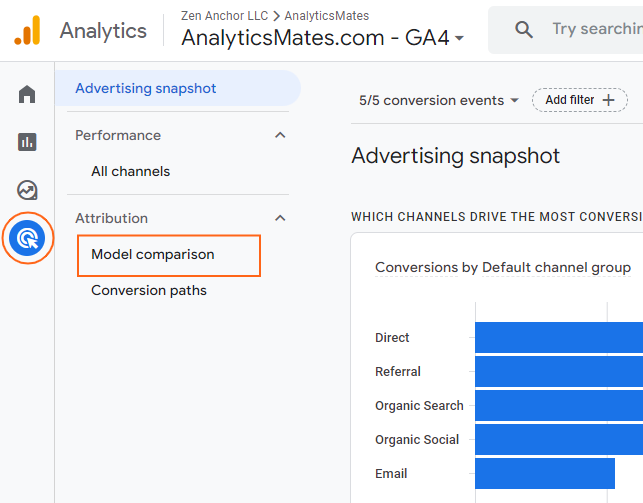
1. In Google Analytics, click Advertising on the left.
2. Go to Attribution > Model comparison.
Select date range and conversion events
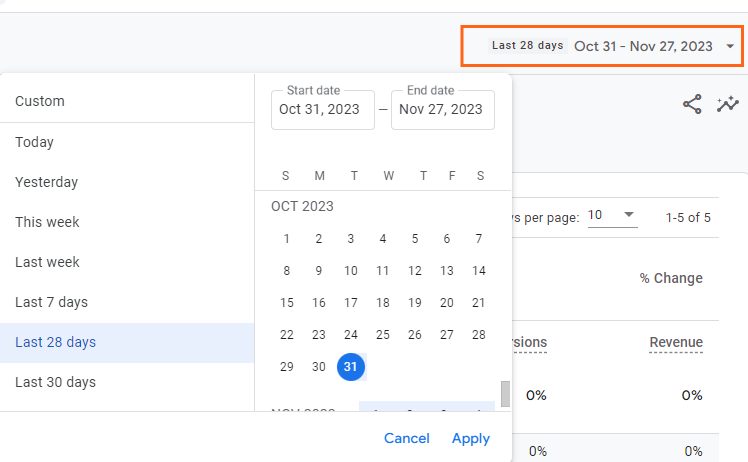
3. Start by selecting a date range from the date picker drop-down menu at the top right.
4. Then select one or more conversion events from the drop-down menu at the top left of the report.
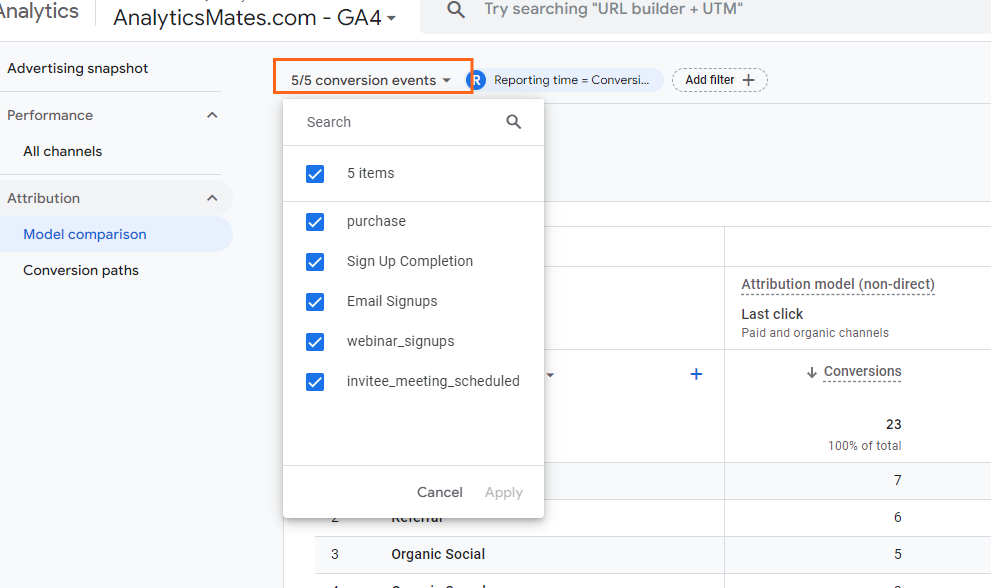
Note: By default, all conversion events are selected, and they’re aggregated together in the report.
Select dimension to report on
5. The data table shows your data broken out by the Default channel group dimension.
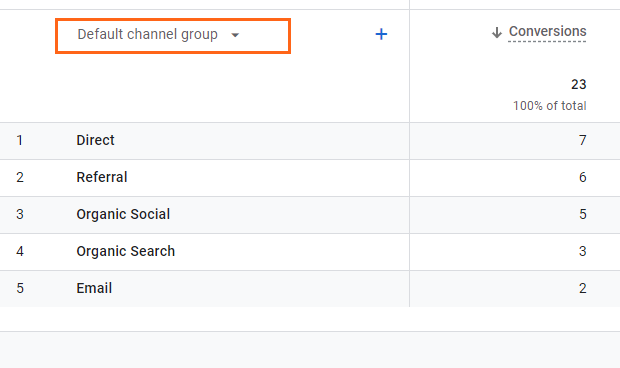
Note: Use the drop-down to view data by the Source/medium, Source, Medium, or Campaign dimensions.
Select attribution models to compare
6. Use the drop-down in the Attribution model (non-direct) columns to choose which attribution models to compare.
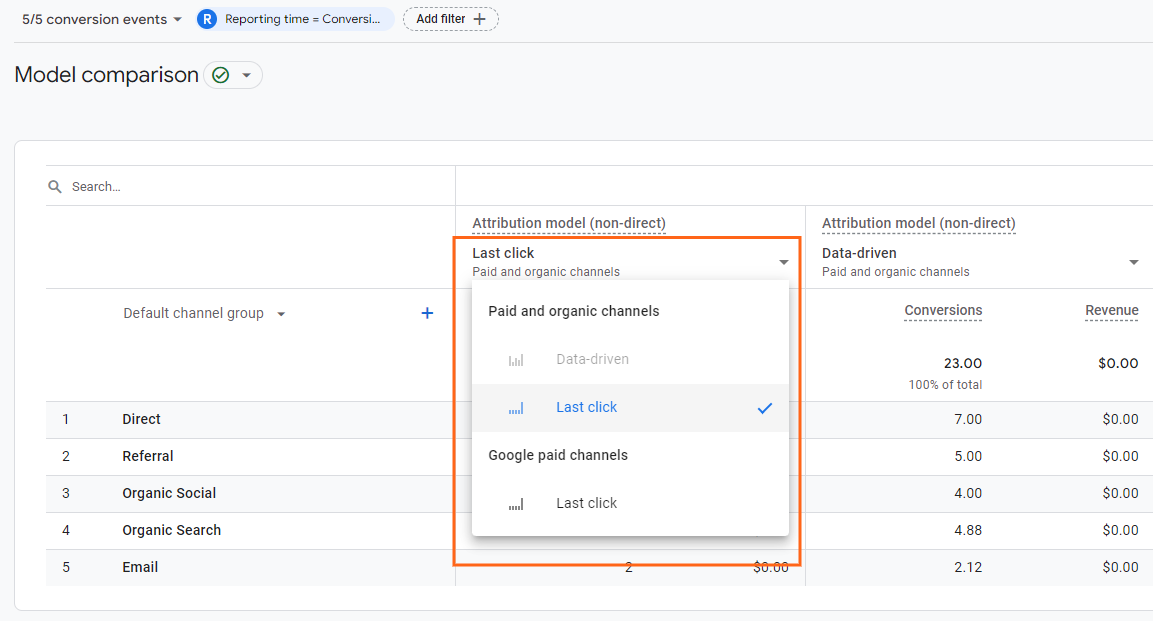
Note: By default, all conversion events are selected, and they’re aggregated together in the report.
You can also customize the report by adding filters.
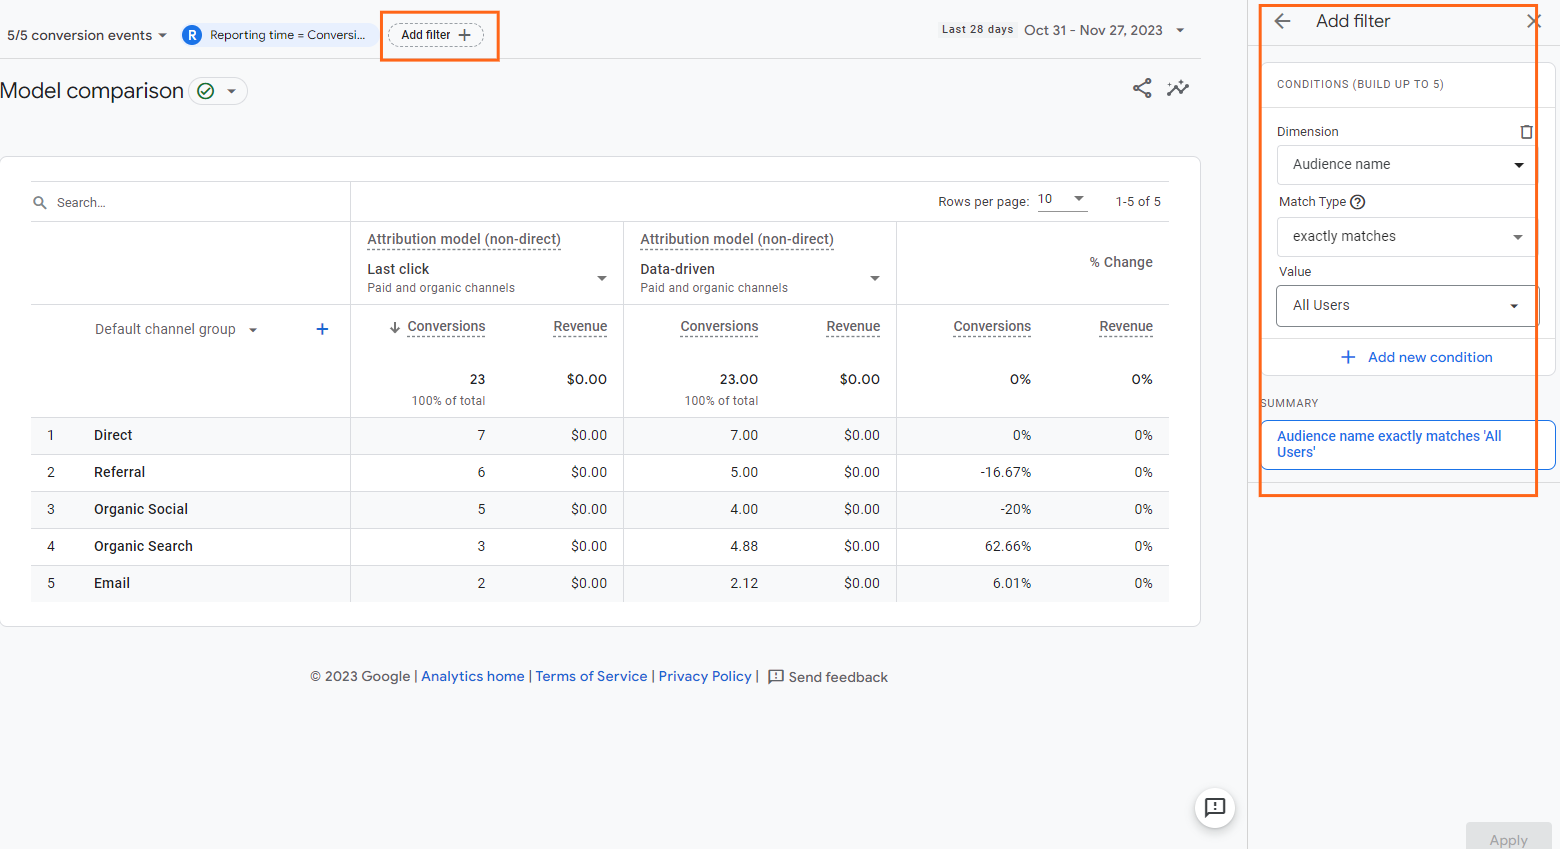
Add a filter (optional)
The report displays data from all users. To see data for a specific set of users, click Add filter at the top left.
You can also share this report with your colleagues or your boss.
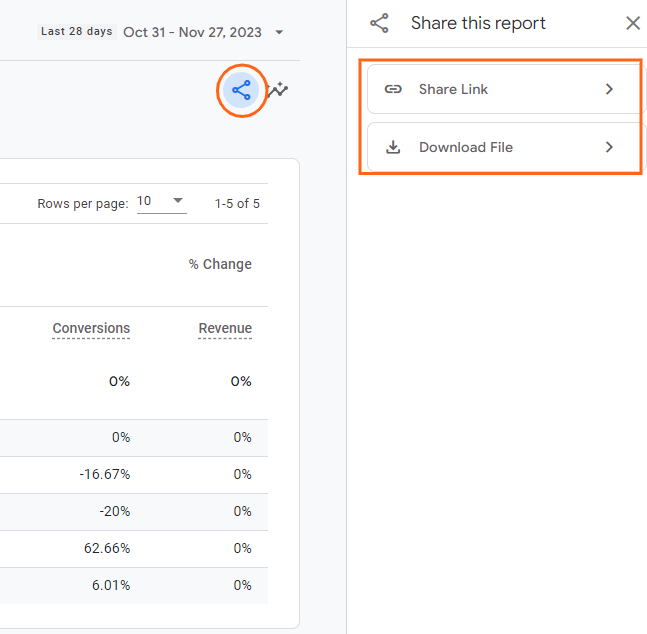
Share, download, or export report
Click Share this report in the top right to share, download, or export the data currently shown in the table.
Conversions Path Report
Note: Use the Conversion paths report to understand your customers’ paths to conversion, and how different GA4 attribution models distribute credit on those paths.
Data Visualization report (top)
The data visualization helps you quickly see which channels initiate, assist, and close conversions.
Tabular Data (bottom)
tabular data organizes information in a table format, making it easy to compare and analyze specific metrics or dimensions. It presents numerical and categorical data in rows and columns, providing a clear and structured overview of website or app performance
Access the report
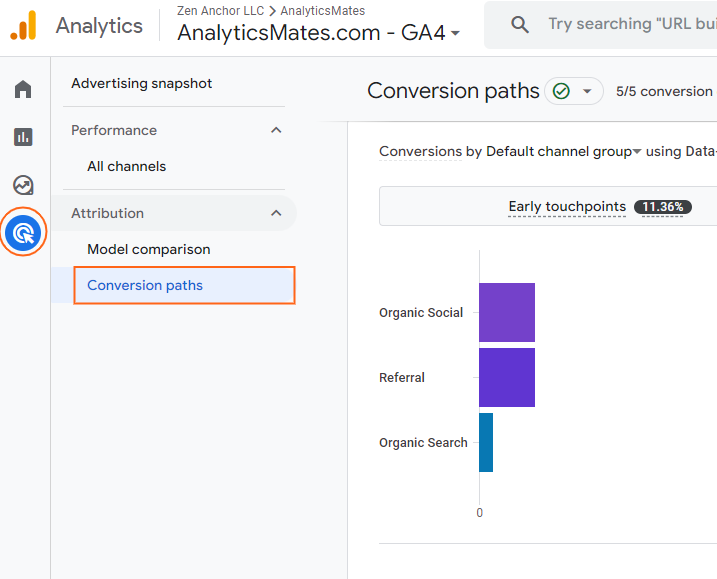
1. In Google Analytics, click Advertising on the left.
2. Go to Attribution > Conversion paths.
Select date range and conversion events
3. Start by selecting a date range from the date picker drop-down menu at the top right.
Then select one or more conversion events from the drop-down menu at the top left of the report.
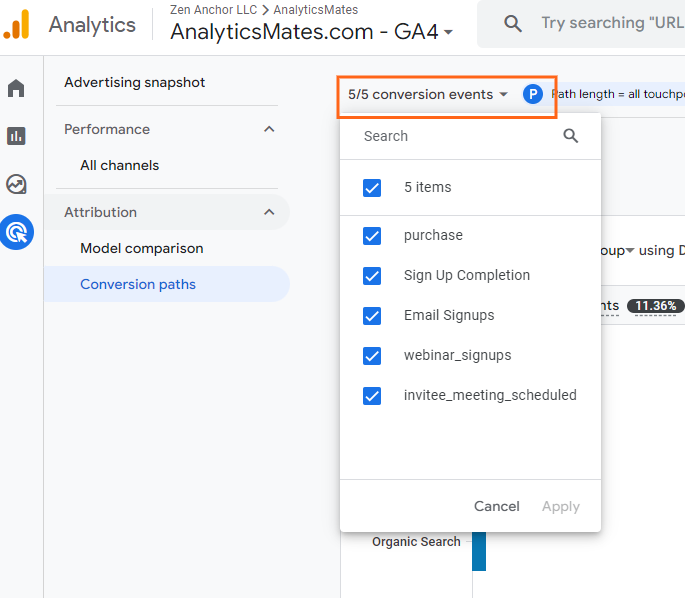
Note: By default, all conversion events are selected, and they’re aggregated together in the report.
Select dimension to report on
Both the chart and the data table show your data broken out by the Default channel group dimension.
Note: Use the drop-downs at the top of the chart and data table to view data by the Source, Medium, or Campaign dimensions.
Select GA4 attribution models to compare
The data visualization at the top of the report displays data as calculated by the Paid and organic channels last click attribution model.
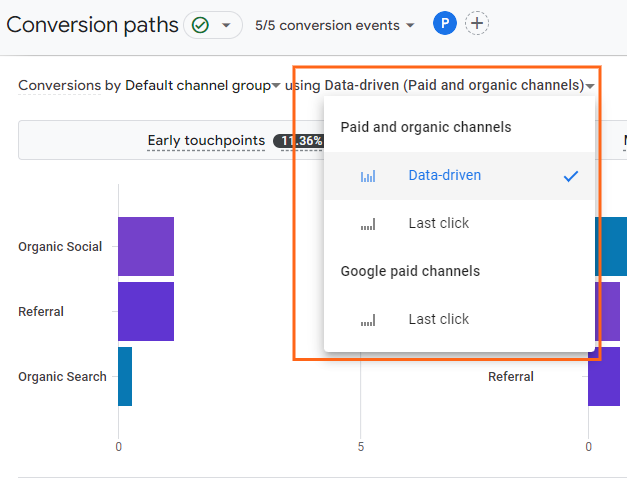
Note: Use the attribution model drop-down to view the data visualization using a different attribution model.
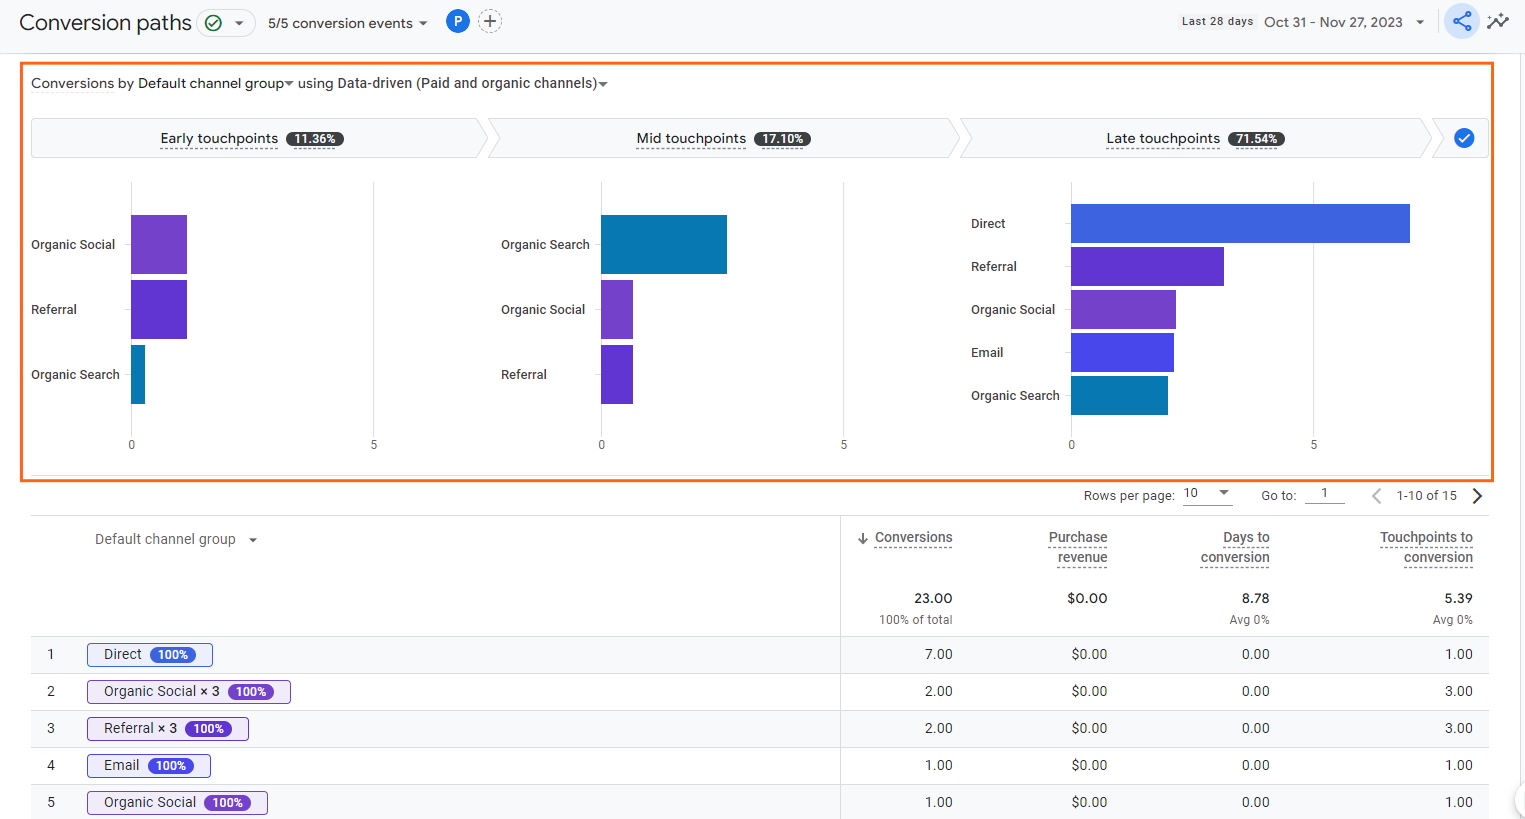
Understand the data - Data Visualization Report
The top of the data visualization shows how much conversion credit each segment of the conversion path receives using the selected attribution model. The segments are defined as follows:
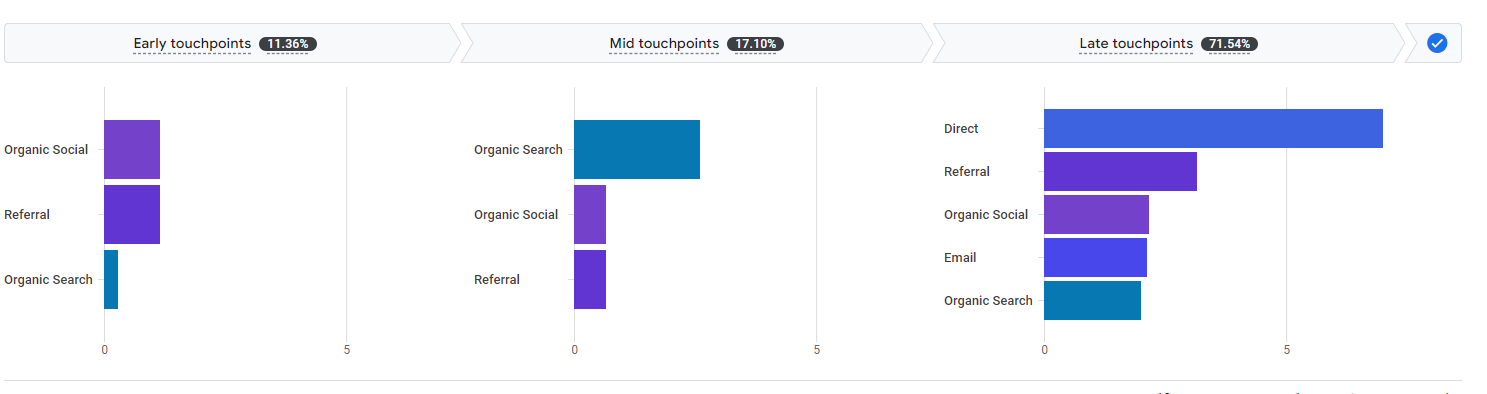
- Early touchpoints: The first 25% of touchpoints in the path rounded to the nearest whole number. This segment is empty if the path has only one touchpoint.
- Mid touchpoints: The middle 50% of touchpoints in the path. If the path has <3 touchpoints, this segment is empty.
- Late touchpoints: The last 25% of touchpoints in the path rounded to the nearest whole number. If the path consists of just one touchpoint, this segment gets all the conversion credit.
Understand the data - Tabular Data Report
The top row of the data table provides an overview of how the selected conversion types are performing. It shows the total Conversions, Purchase revenue, Days to conversion, and Touchpoints to conversion.
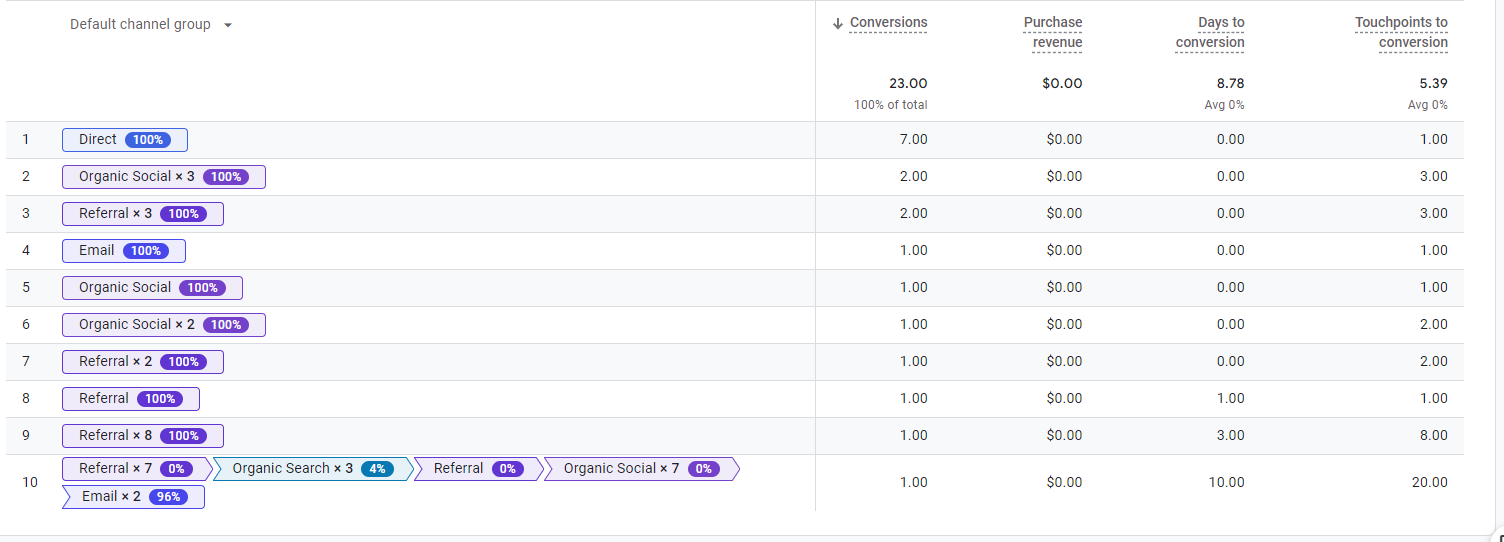
- By default, the report is sorted by paths with the highest number of conversions. Click the down arrow next to one of the other metrics to sort by that metric.
- The credit displayed in each row is an average across the individual paths included in that row.
Frequently Asked Questions
What’s the difference between the Model comparison and Conversion paths reports?
Model comparison shows how conversions are attributed across different models, while Conversion paths give a detailed view of the specific touchpoints users take before converting.
What information does the Conversion paths report provide?
It shows the sequence of interactions users take before converting, including channels, events, and timestamps.
How can I use the Conversion paths report to improve my marketing?
Identify common paths leading to conversions and identify potential bottlenecks or missed opportunities.
Final Word
Alright, we’ve reached the end of our trek through the wondrous world of GA4 attribution reports. But fear not, this isn’t a dead end – it’s just the launchpad for your own marketing mastery!
By now, you’ve hopefully unearthed significant learnings within these reports. So, don’t let this adventure end here. Grab your newfound knowledge, strap on your data goggles, and dive deeper into GA4. Experiment with different GA4 attribution models, track those user paths like a seasoned explorer, and let the insights guide your marketing to new heights.
The magic of GA4 attribution is yours to command. Go forth, unlock its secrets, and watch your marketing efforts rise like golden phoenixes!
Thank you for reading!
We’re always looking for ways to improve our Google Analytics 4 blog content. Please share your feedback so we can make it even better.
Work with us
Need this done for your property?
Analytics Mates handles GA4 setup, GTM implementation, Looker Studio dashboards, and the ongoing measurement operations that agencies and in-house teams don't have bandwidth for.