2025 Updates to Google Analytics 4 - Here's What You May Have Missed

Google Analytics 4 (GA4) continues to grow, and 2025 has already introduced several important updates that marketers, analysts, and business owners should have on their radar. Whether you’re just getting started with GA4 or have been working with it since its early release, it’s understandable how easy it can be to miss the smaller, but meaningful, changes. That’s why we’ve put together this guide — to help you catch up and stay ahead of the curve.
In this post, we’ll walk you through the most important GA4 updates rolled out so far this year, including improvements to reporting, interface updates, and expanded use of machine learning. We’ll also break down what these changes mean for your day-to-day reporting, broader strategy, and how they could shape the insights you rely on moving forward. Let’s jump in.
New Google Analytics 4 Updates Every Marketer Should Know About
Google’s platforms have been moving faster than ever lately — you’re not imagining it. Between GA4, GTM, and Looker Studio, there have been some major changes, and honestly, a few of them are too useful to ignore.
Here’s a quick (but important) roundup of what’s new and why it matters.
GA4 Now Lets You Add Annotations Directly Into Reports
If you ever found yourself missing the ability to add down notes right on your Google Analytics reporting —like we used to do in Universal Analytics—and Let’s be honest—trying to track key site changes in GA4 without annotations was a headache. People turned to all sorts of workarounds, from browser plugins to scribbling notes in spreadsheets, just to keep up. It felt like a big step back, especially after how simple it was in Universal Analytics. For a lot of us, the feature was sorely missed. So now that annotations are finally back in GA4, it’s a welcome update—and honestly, about time.
For those who are new about what this is all about, this long-awaited feature lets you mark key dates and events directly on your reports, so you and your team can quickly connect data changes to real-world actions. You can now easily flag events like:
- A major campaign launch
- A full site redesign
- A technical outage or tracking issue
Manually adding these notes inside the GA4 interface helps keep your data grounded in context. Here’s a quick look of what it should look like in your report.
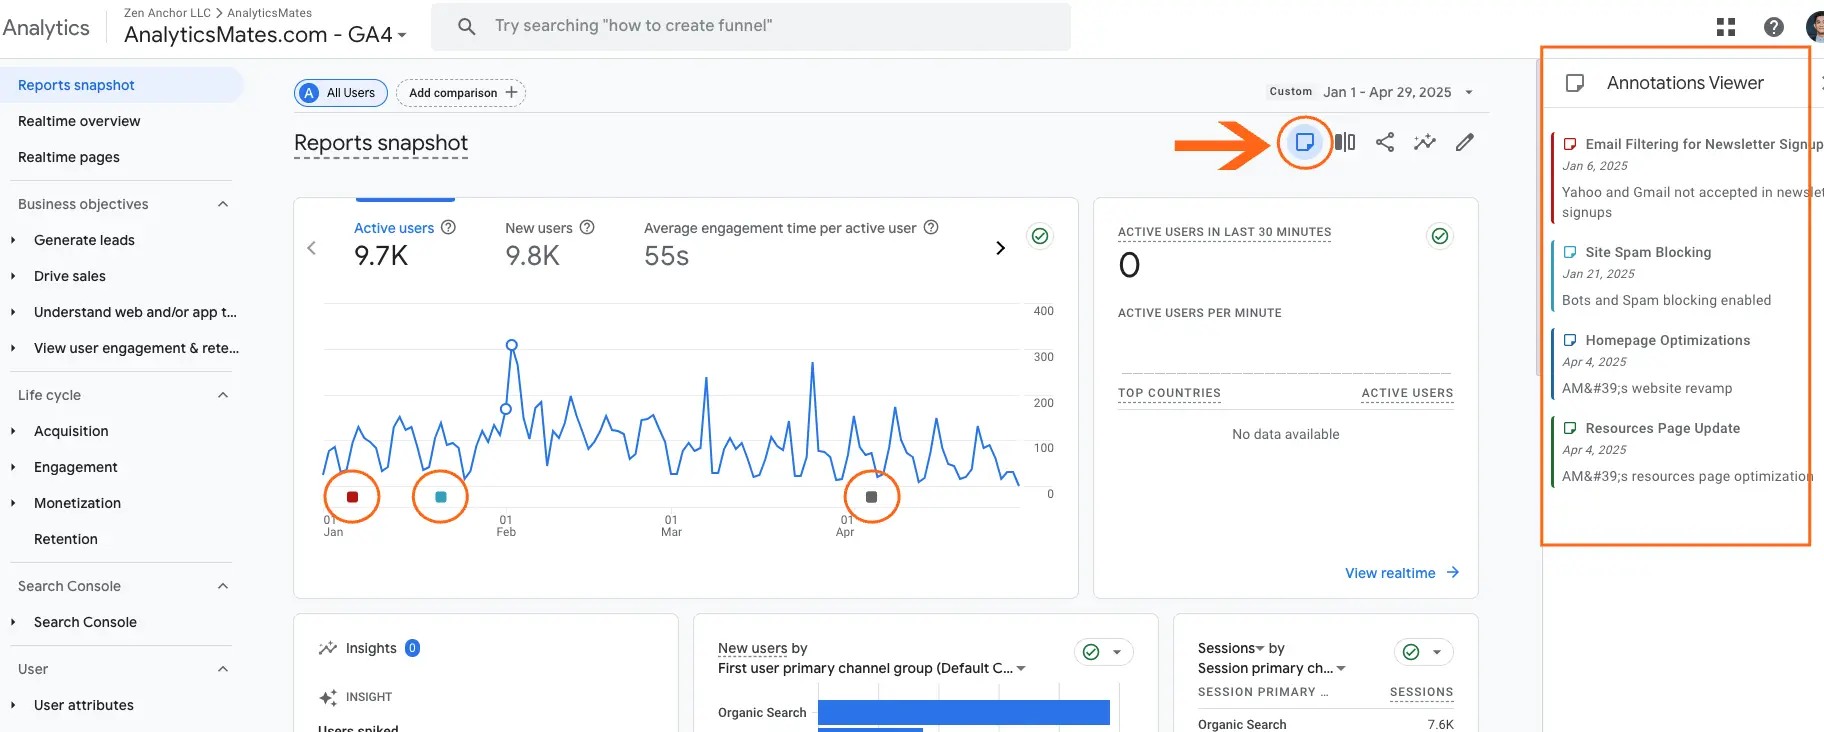
Why Annotations Matter
Looking back at your analytics after a few weeks (or even longer), it’s surprisingly easy to forget what led to a sudden jump—or drop—in performance. That’s where annotations come in. They:
- Help users align faster when digging into historical reports
- Provide quick context without needing to cross-reference calendars or Slack threads
- Support better decision-making by connecting numbers to real-life events
Pro Tip:
Make it a habit across your team to log annotations consistently—especially during launches, promotions, or site changes. It’ll save you hours of backtracking down the road.
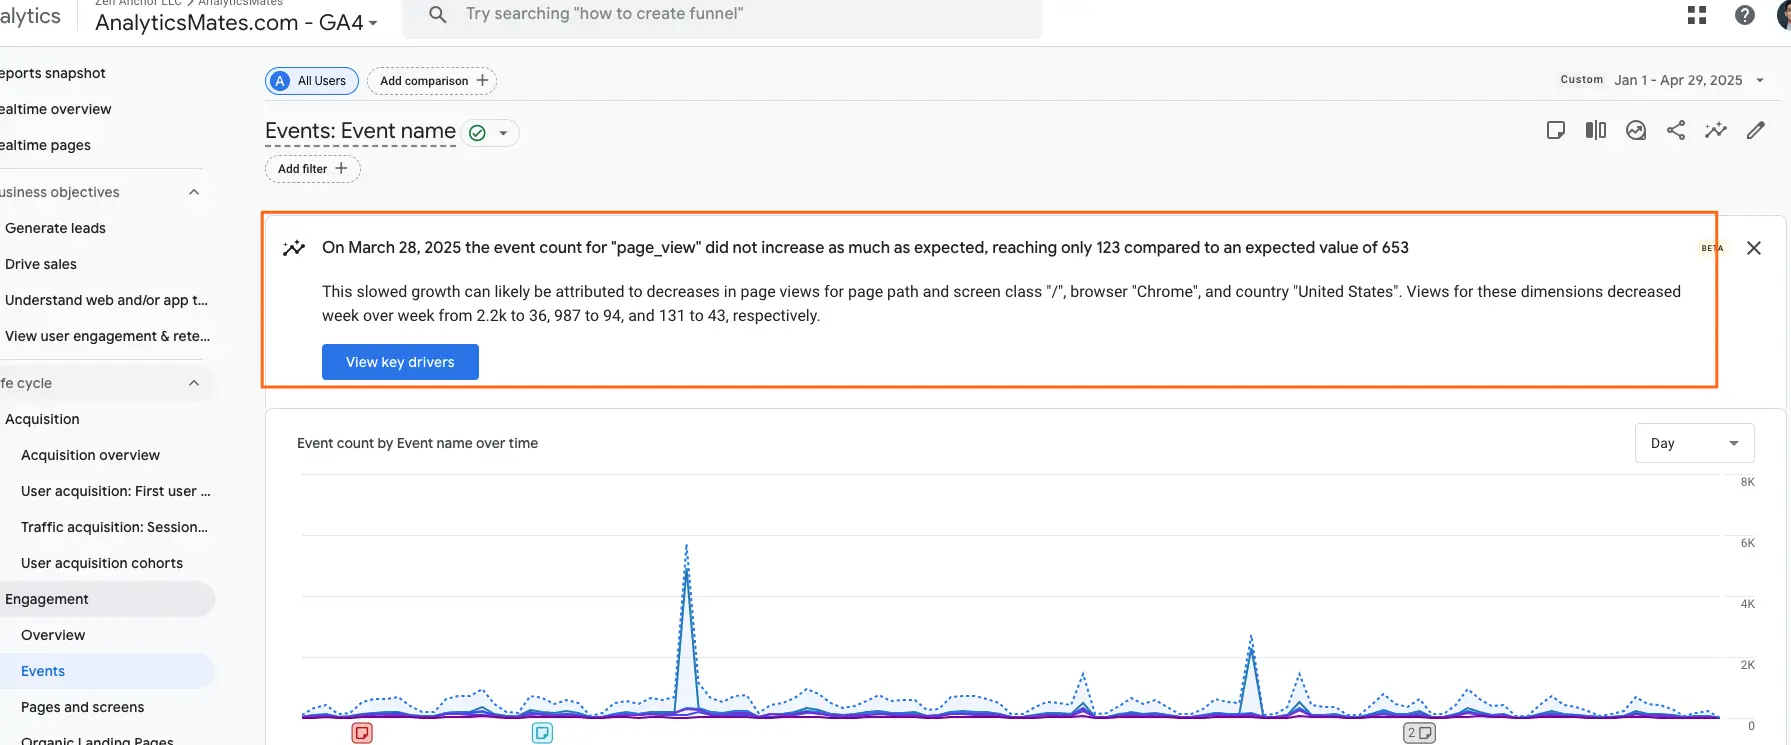
Google Analytics 4: Generated Insights Directly in Reports
If you’ve used GA4 for any amount of time, you know that navigating through reports to find out what’s changed—and why—can sometimes feel like detective work. But that’s starting to change. In 2025, Google introduced AI-powered “Generated Insights” directly within detailed reports, giving users a much clearer view of what’s happening in their data, without having to dig endlessly through charts and filters.
It’s kind of like the annotation feature—but with a twist. While annotations let you mark what happened and when, Generated Insights actually help you understand what’s changed in your data, often before you even notice it yourself. The two features really complement each other. Say there’s a sudden spike in traffic during a certain time period—GA4’s Generated Insights will flag it and suggest possible reasons. Then, you or your team can drop an annotation to note what actually caused it, like a campaign launch or a site update. Together, they turn guesswork into clarity.
These insights appear in plain language, so even non-analysts on your team can quickly understand key changes. No need to second-guess whether a traffic spike was just random or something you should act on. GA4 now surfaces likely causes right in the report, helping you connect the dots instantly.
Examples of what GA4 might flag include:
- A new marketing campaign went live
- Pricing adjustments were made on a product or category
- A technical issue affected the site’s performance or tracking
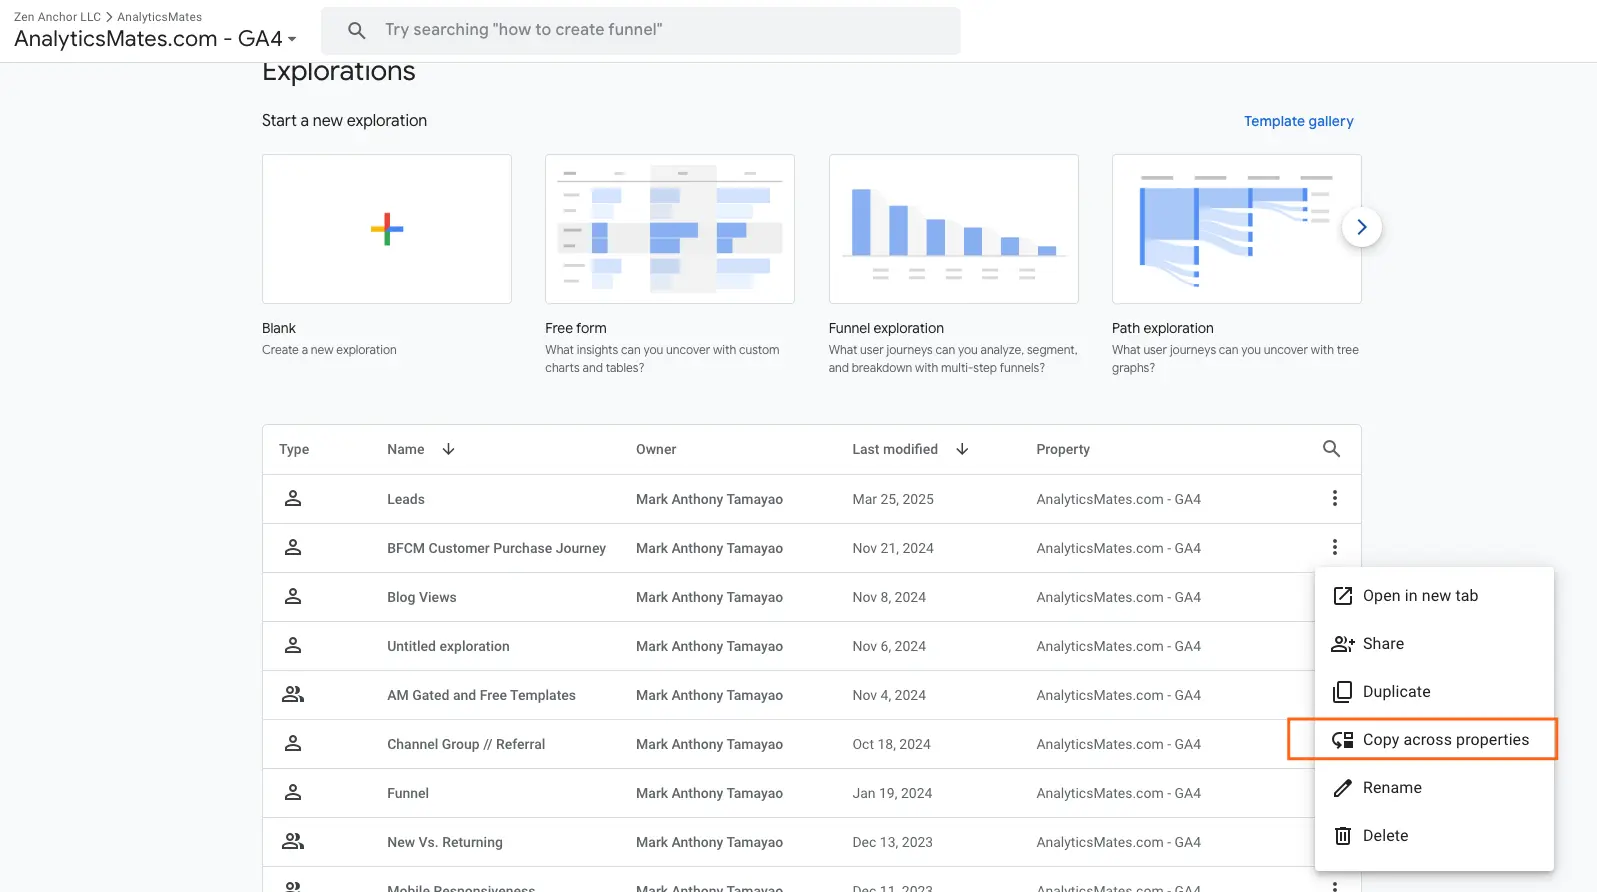
Google Analytics 4: Copy Reports and Explorations Between GA4 Properties
For anyone juggling multiple Google Analytics 4 (GA4) properties—whether you’re working at an agency, managing several websites, or just dealing with complex setups—there’s some genuinely helpful news. As of March 2025, GA4 finally supports the ability to copy reports and explorations from one property to another.
This might not sound revolutionary at first, but if you’ve ever had to manually rebuild the same custom reports over and over again for different clients or business units, you know how tedious that can be. This new feature removes a lot of that unnecessary repetition.
What You’re Now Able to Copy
There are a few different things you can move between properties:
- Custom standard reports—these are the ones you’ve either built from scratch or tweaked within the “Reports” workspace.
- Explorations from the “Explore” section, including free-form, funnel, path explorations, and others.
- Collections and topics that help you organize and present reports more cleanly within the interface.
How the Process Works
If you’re editing a report or an exploration, you’ll now see an option to “Copy to another property.” Click that, choose your destination property, and GA4 will take care of the rest. It keeps your formatting, charts, chosen dimensions, and metrics intact—as long as the destination property supports them.
Worth mentioning: if a particular metric or dimension doesn’t exist in the target property (maybe it’s not being tracked there, or the data model differs), GA4 will flag it for you. You won’t be left wondering why something looks off after copying—it’s clear about what made it over and what didn’t.
Why This Update Actually Matters
It’s not just a time-saver, though that’s a big part of it. If you’re handling multiple properties that need similar reports—say, for multiple brands under the same company—it’s been a pain point for a while. Now you can build a report once, refine it, and then push it across properties without having to rebuild from scratch every time.
Beyond just convenience, this helps with consistency. Using the same report structure across properties means fewer mistakes, easier comparisons, and more reliable insights. Especially in fast-paced environments where you don’t have time to double-check whether a metric was set up exactly the same way across multiple dashboards.
It’s also a smart way to scale what’s already working. If you’ve built an exploration that gives you meaningful insights in one property, you can now reuse that work elsewhere without having to start from square one.
A Quick Word of Caution
Just be sure that the data structures between your properties are reasonably aligned. If one property is set up completely differently—using different event names, missing key parameters, or tracking entirely different user journeys—you may find some parts of your reports don’t transfer over cleanly. That’s not a failure of the tool; it’s just something to watch out for.
Now, stepping away from Google Analytics 4 for a moment—let’s take a look at some of the key updates that rolled out for Looker Studio in 2025.
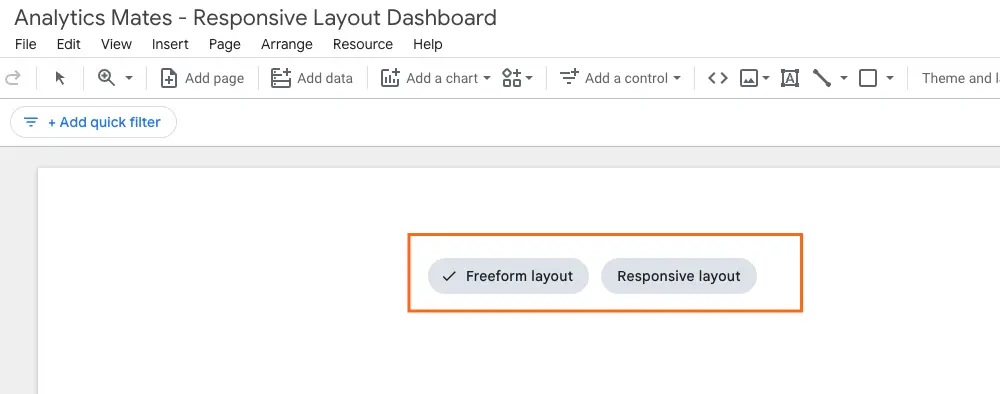
Looker Studio: Responsive Layouts for Reports
For anyone who’s spent time building reports, one of the biggest headaches used to be how terrible dashboards looked on phones. Clunky layouts, broken charts, endless side-scrolling—it wasn’t a great experience.
That’s finally changing. Looker Studio now supports Responsive Layouts, which use a flexible 12-column grid to automatically adjust your dashboard’s design across screen sizes. This update couldn’t have come at a better time. These days, most people prefer to check reports on their phones rather than pulling out a laptop or firing up a desktop just to view a dashboard built in Looker Studio.

Why It Matters
Whether your client’s viewing the report on a desktop or checking stats quickly on their phone, it’ll now look clean, clear, and easy to navigate. That means fewer complaints, better engagement, and reports that feel professional—no matter where they’re opened.
Caveat
if you’re using an older Looker dashboard and it was set up with the freeform layout, you can’t switch it to responsive later. Kind of annoying, yeah. So if you’re planning to go responsive, make sure you pick that before you start building anything. Once it’s in freeform, it stays that way.
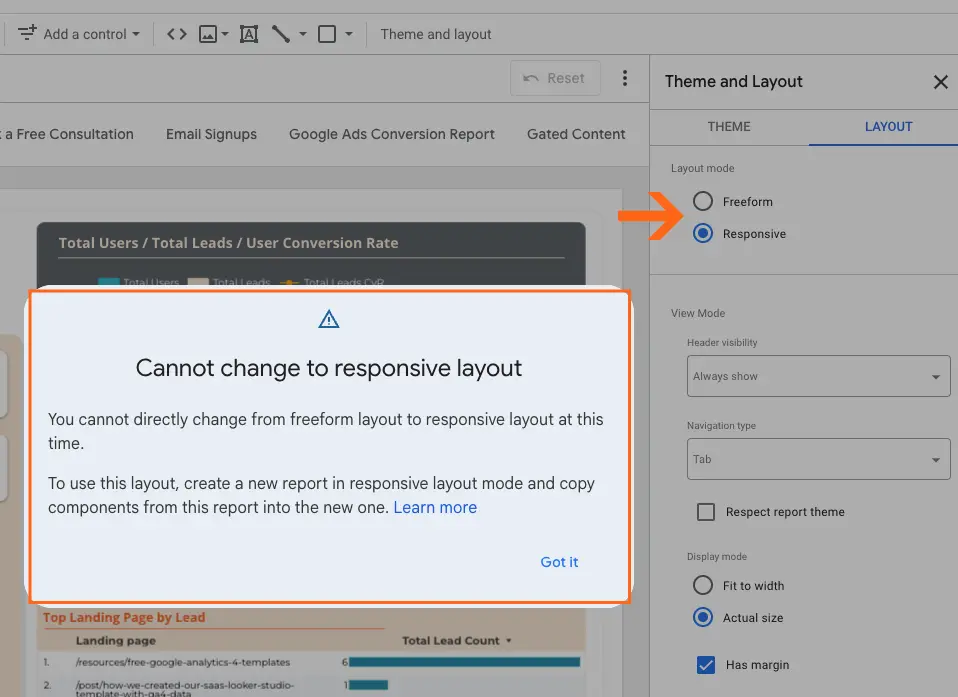
Actually, if you are going to build a new dashboard Looker Studio will ask you directly if you will be creating a freeform or responsive layout.
Grab the 2025 Analytics Update Cheat Sheet
Trying to keep up with every change across GA4, GTM, and Looker Studio in 2025? You’re not alone—it’s a lot. To make things easier, we’ve pulled together a free, easy-to-digest PDF covering the Top 20 updates you need to know to stay ahead. You’ll find quick summaries, practical tips, and next steps you can act on right away.
FAQs
While we’ve done our best to cover the biggest updates in this blog post and the free downloadable resource, there are still a few additional features and changes we couldn’t fully dive into. To make sure you don’t miss out on those smaller but still important details, we’ve put together an FAQ section here. It’s a quick way to answer extra questions you might have and highlight some updates that didn’t make it into the main content.
1. Has GA4 added any improvements to custom report scheduling in 2025?
Yes. In 2025, GA4 now allows users to schedule email deliveries of custom reports directly inside the platform. You can choose daily, weekly, or monthly schedules, making it easier to automate regular reporting without needing a third-party tool.
2. Are there new privacy or consent management features added to GA4 in 2025?
GA4 has expanded its support for Consent Mode V2. Now, consent signals are more tightly integrated into reports, allowing you to view how much of your data comes from consented vs modeled users. This makes compliance reporting much easier.
3. What changes were made to GTM’s server-side tagging setup in 2025?
GTM Server-Side received updates to its tagging permissions, allowing better control over what data is collected and sent to each vendor. Google also simplified server container setup with easier App Engine deployment templates in 2025.
4. Did Looker Studio introduce new data blending improvements in 2025?
Yes, Looker Studio now supports multi-source blending with smarter join keys. You can combine more than two data sets without needing complex formulas, and mismatched fields are flagged with suggestions on how to fix them.
5. Has Google Analytics 4 improved audience management in 2025?
Absolutely. GA4 rolled out predictive audience expansion this year. Now you can create audiences not only based on behavior but also based on likely future actions, like predicting which users are most likely to make a purchase or churn.
6. Did Looker Studio add new connectors for 2025?
Yes. New native connectors were launched for TikTok Ads, Amazon Ads, and Salesforce CRM. This means fewer workarounds and faster dashboard creation across more ad and CRM platforms, straight out of Looker Studio’s Data Sources panel.
7. Is there a faster way to test and debug tags in GTM in 2025?
Definitely. GTM upgraded its preview mode with an “Instant Preview” feature, significantly reducing load times when testing container changes. It also now highlights tag firing issues in real-time, helping marketers troubleshoot faster.
8. Has GA4 introduced any new metrics for engagement reporting in 2025?
Yes. GA4 now includes “Time to First Action” as a built-in metric, showing how long it takes users to perform meaningful actions (like clicks, scrolls, or conversions) after landing on your site or app. It offers deeper insights into user engagement quality.
Final Thoughts
Honestly, trying to keep up with Google’s tools can be kind of exhausting. Just when you think you’ve got the hang of something, they roll out another change—new buttons, new dashboards, a totally different way to look at your numbers. It’s a lot. But weirdly enough, some of the 2025 updates (GA4, GTM, Looker Studio—those ones especially) actually help. They’re not just visual tweaks or behind-the-scenes fixes; they do make your job easier if you give them a chance.
Of course, not everything comes with a big flashy announcement. Some of the most useful stuff just shows up one day, and if you’re not poking around, you’ll miss it. That’s why it’s worth staying curious. Try things. Take notes. Leave yourself breadcrumbs—like little reminders—so you’re not starting from scratch later.
And here’s something I’ve noticed: the features you shrug off today? They might be the ones you rely on every day in six months. Funny how that works.
Thank you for reading!
We’re always looking for ways to improve our Google Analytics 4 blog content. Please share your feedback so we can make it even better.
Work with us
Need this done for your property?
Analytics Mates handles GA4 setup, GTM implementation, Looker Studio dashboards, and the ongoing measurement operations that agencies and in-house teams don't have bandwidth for.